
FIG 5.
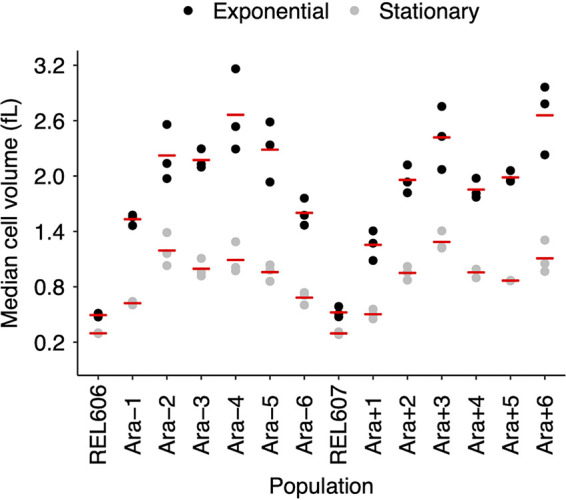
Cell sizes measured during exponential and stationary phases of ancestral strains and 50,000-generation clones from all 12 populations. Each point represents the median cell volume for one assay at either 2 h (exponential growth) or 24 h (stationary phase) in DM25. Horizontal bars are the means from the 3 replicate assays for each strain. The points for some individual replicates are not visible because some values were almost identical.