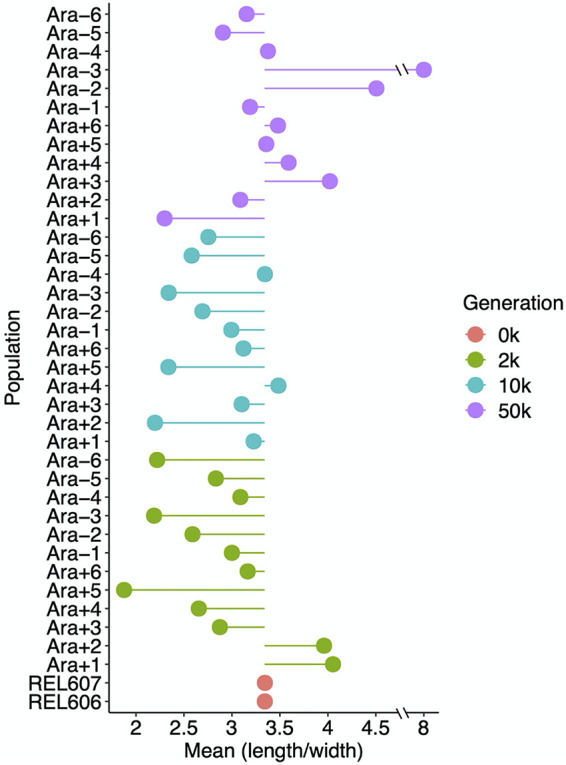
FIG 8.

Average cell aspect ratios (length/width) of ancestral and evolved clones. Each point shows the mean ratio for the indicated sample. The lines show deviations in the aspect ratio from the ancestral state. The mean aspect ratios were calculated from three replicate assays in all but 4 cases (Ara−4 at 10,000 generations and Ara−2, Ara−4, and Ara−5 at 50,000 generations), which had two replicates each.
