
FIG 6.
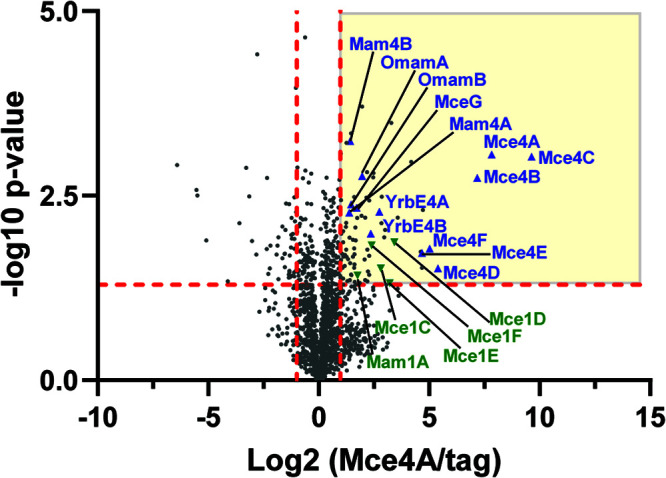
LFQ of proteins enriched in the Mce4A-HA immunoprecipitation. Proteins identified by two or more unique peptides in an Mce4A-HA immunoprecipitation, compared to an HA-only control, are shown plotted by log2(Mce4A-HA/control) and −log10(P value). Proteins with P values of <0.05 and a minimum of 2-fold enrichment (log2 = 1.0) in the Mce4A-HA immunoprecipitate, compared to the control, were considered interactors (yellow quadrant). Mce4 transporter component proteins are marked on the plot with blue triangles, and Mce1 transporter components are marked with green inverted triangles.