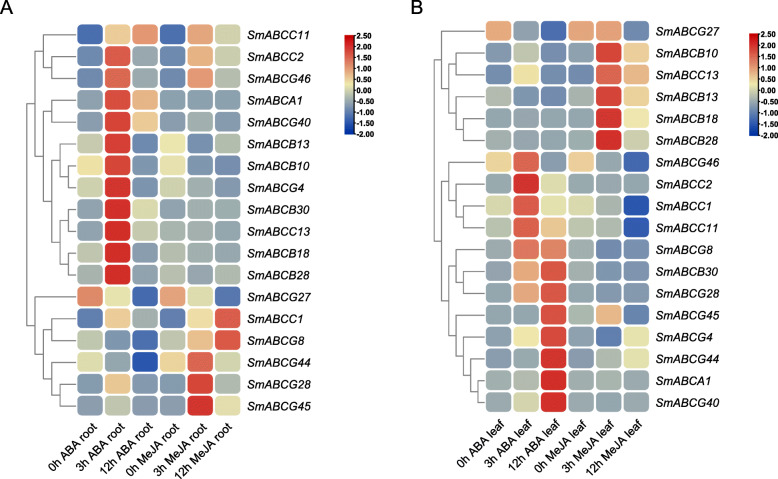
Fig. 7.
qRT-PCR detection of the expression profiles of the 18 selected genes induced by ABA and MeJA. Heat maps of the relative expression of 18 SmABCs under the treatment of ABA and MeJA. Scaled log2 expression values based on qRT-PCR data are shown from blue to red, indicating low to high expression. a The relative expression of these SmABCs in the root of 1-year old S. miltiorrhiza seedling under ABA (10 mM) and MeJA (200 μM) treatment. b The relative expression of these SmABCs in the leaves of 1-year old S. miltiorrhiza seedling under ABA (10 mM) and MeJA (200 μM) treatment

