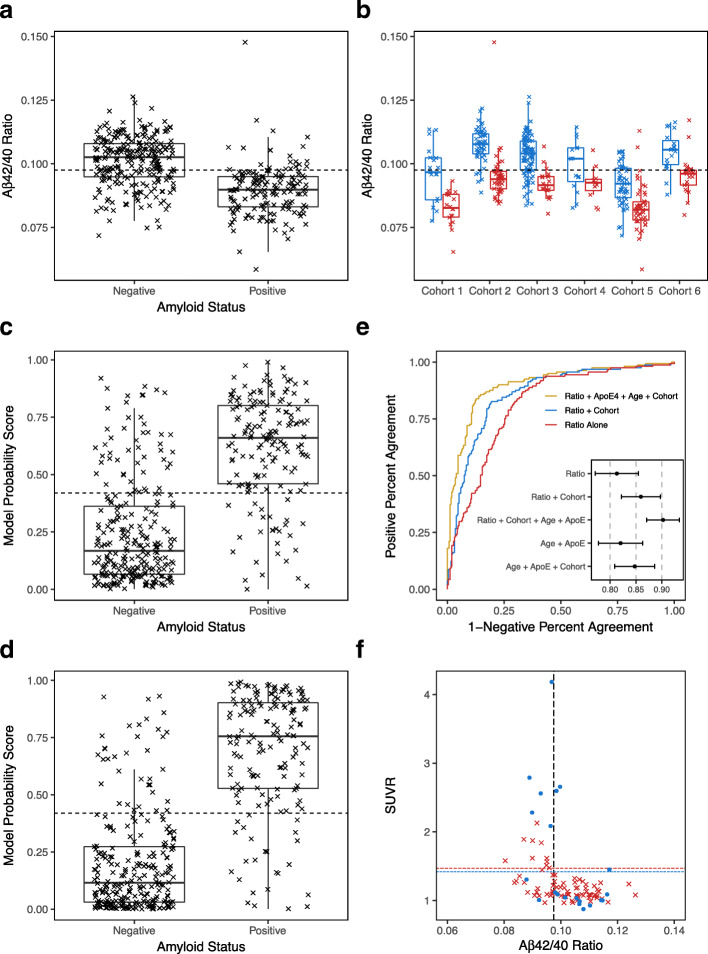
Fig. 1.
Diagnostic Performance Plots, Metrics, and Prediction Parameters for Plasma Biomarkers Measured Using LC-MS/MS. a Plasma Aβ42/40 concentration ratios were lower in amyloid positive than negative participants (n = 414). Scatter-Box-Whisker plot of plasma Aβ42/40 for participants classified as brain amyloid negative or positive. Optimal plasma Aβ42/40 cutoff value (0.0975) = dashed horizontal line; Median = dark horizontal lines; 25th to 75th quartiles = Box; 95% Confidence Interval = Whisker. b In each cohort, plasma Aβ42/40 ratios were consistently lower in amyloid positive than negative participants. Plasma Aβ42/40 ratios separated by brain amyloid status (Blue = Negative; Red = Positive) for each cohort. Dashed horizontal line is the optimal plasma Aβ42/40 cutoff value (0.0975) based on ratio alone (same as dashed line in a). c Amyloid probability scores were higher in amyloid positive than negative participants. A logistic regression model using plasma Aβ42/40 and cohort to generate a model probability score that predicted brain amyloid status. Scatter-Box-Whisker plots of individual probability scores (0.0–1.0) separated by amyloid status. Optimal model-derived probability score that differentiated amyloid positive from negative (0.42) = dashed horizontal line. d Amyloid probability scores derived from a logistic regression model that used plasma Aβ42/40, number of ApoE4 alleles, age and cohort to predict brain amyloid status. Scatter-Box-Whisker plots of individual amyloid probability scores (0.0–1.0) separated by amyloid status. e Receiver Operating Characteristic curves (ROC) plotted using: participants’ plasma Aβ42/40 ratio, ApoE4, age, and cohort (gold plot; AUC-ROC = 0.90 and 95% CI shown in insert); plasma Aβ42/40 and cohort (blue plot; AUC-ROC = 0.86); and only plasma Aβ42/40 (red plot; AUC-ROC = 0.81). For comparison, the insert also shows AUC-ROC and 95% CI for ApoE4 and age (0.82), and ApoE4, age and cohort (0.84). f Four-quadrant plot illustrating the relationship between quantitative PiB SUVR values and plasma Aβ42/40 ratios and cutoff value (dashed vertical line = 0.0975) for two cohorts (n = 103). Cohort 3 used PiB SUVR cutoff = 1.47 (Red (x) and dashed horizontal line), cohort 6 used 1.42 (Blue filled dots (•) and dashed horizontal line). Three false negative plasma Aβ42/40 results in the upper right quadrant. Twenty false positive plasma Aβ42/40 results in the lower left quadrant that may represent participants with elevated risk for converting to amyloid PET positive in the future

