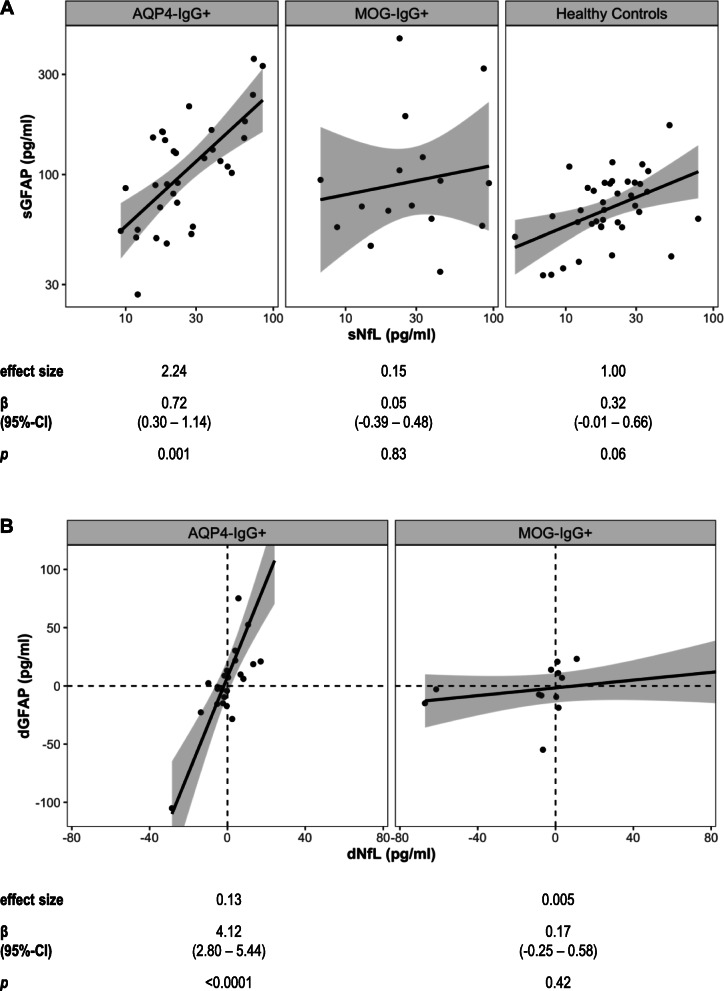
Fig. 4.
Associations between sGFAP and sNfL. a Association between log-transformed baseline sGFAP and sNfL in patients with AQP4-IgG+ NMOSD (n = 33), MOG-IgG+ patients (n = 16) and healthy controls (n = 38). b Association between changes in sGFAP (dGFAP) and sNfL (dNfL) concentrations, i.e., difference between one year and baseline values, in patients with AQP4-IgG+ NMOSD (n = 24) and MOG-IgG+ patients (n = 13). In Fig. 4b, one datapoint of an AQP4-IgG+ patient (dGFAP = 221.1 pg/ml, dNfL = 24.2 pg/ml) is not plotted for better visualization of datapoints with lower dGFAP, but included in the analyses. Results of linear models using log-transformed sGFAP and sNfL values adjusted for age and, where applicable (b), log-transformed time since last attack are shown below the plots. AQP4-IgG aquaporin-4 immunoglobulin G, β regression coefficient, CI confidence interval, dGFAP difference in sGFAP between one year and baseline, dNfL difference in sNfL between 1 year and baseline, effect size standardized effect size, MOG-IgG myelin oligodendrocyte protein immunoglobulin G, NMOSD neuromyelitis spectrum disorders, sGFAP serum glial fibrillary acidic protein, sNfL serum neurofilament light chain protein

