
Figure 2:
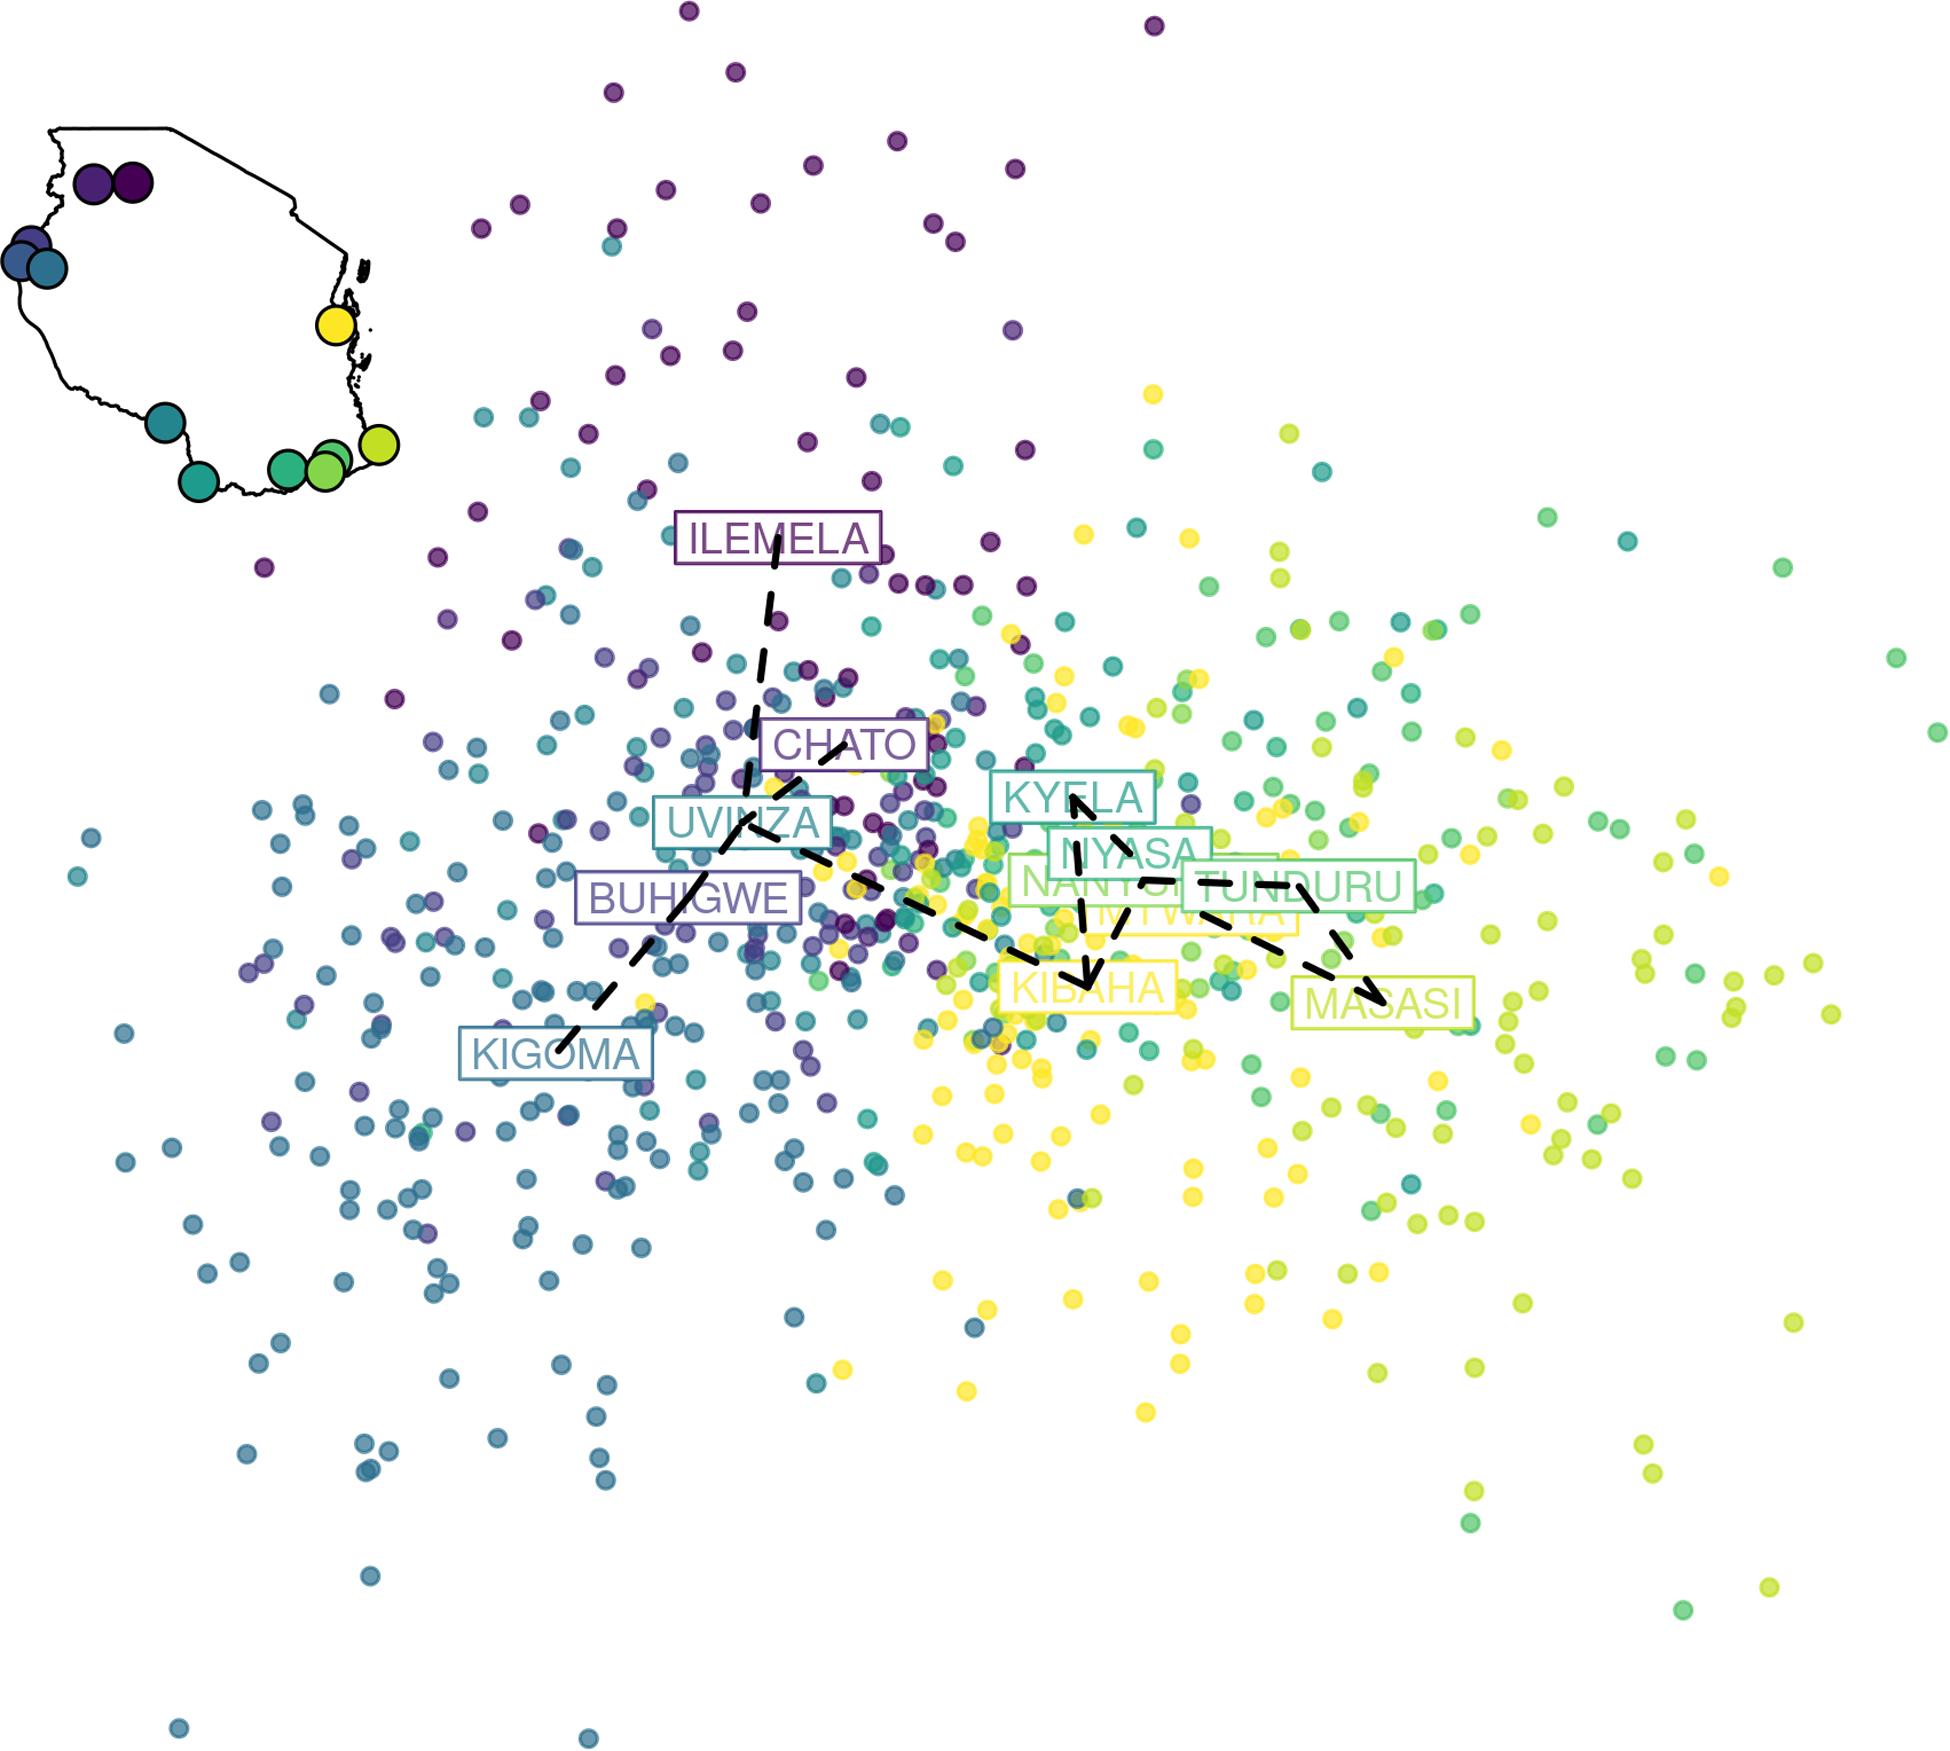
Separation of Tanzanian P. falciparum samples by geographic region using discriminatory analysis of principal components (DAPC). DAPC analysis using the first 112 components of a principal component analysis (PCA) is shown (explaining 46% of the variation in the original PCA). Each dot is a sample colored by its geographic origin based on the 12 districts included in the analysis (inset map). A minimum spanning tree, constructed from genetic distances between groups, is overlaid on the plot (black dashed line).