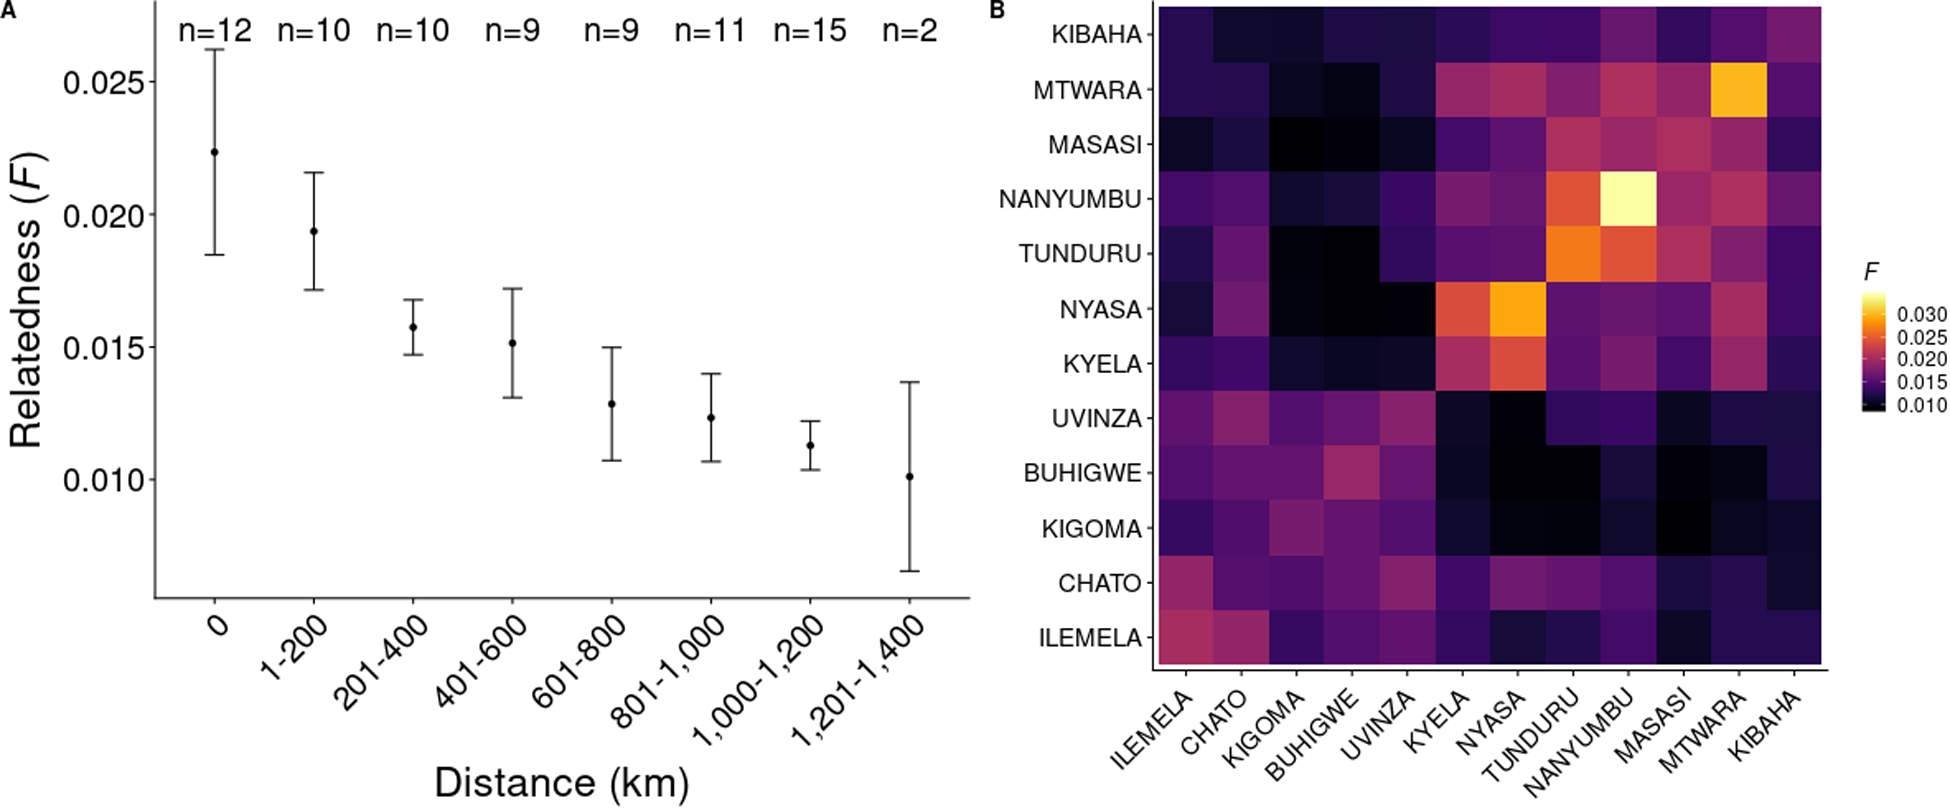
Figure 4:

Genetic relatedness by geographic distance. A. Relatedness (as measured by the inbreeding coefficient F) binned by geographic distance (greater circle distance). An average-of-averages approach (average of all district-level average F) was used to avoid district comparisons with more samples contributing more to a bin. Bars represent 95% confidence intervals. The number of district-level pairwise comparisons in each bin is shown at the top of the plot (for example, there are 12 districts included in this analysis, so the number of same-district comparisons in n=12 for bin size 0 km). B. Heatmap of averaged F between districts. Districts are arranged by geographic location (north and northwest, to south and southeast, to east).
