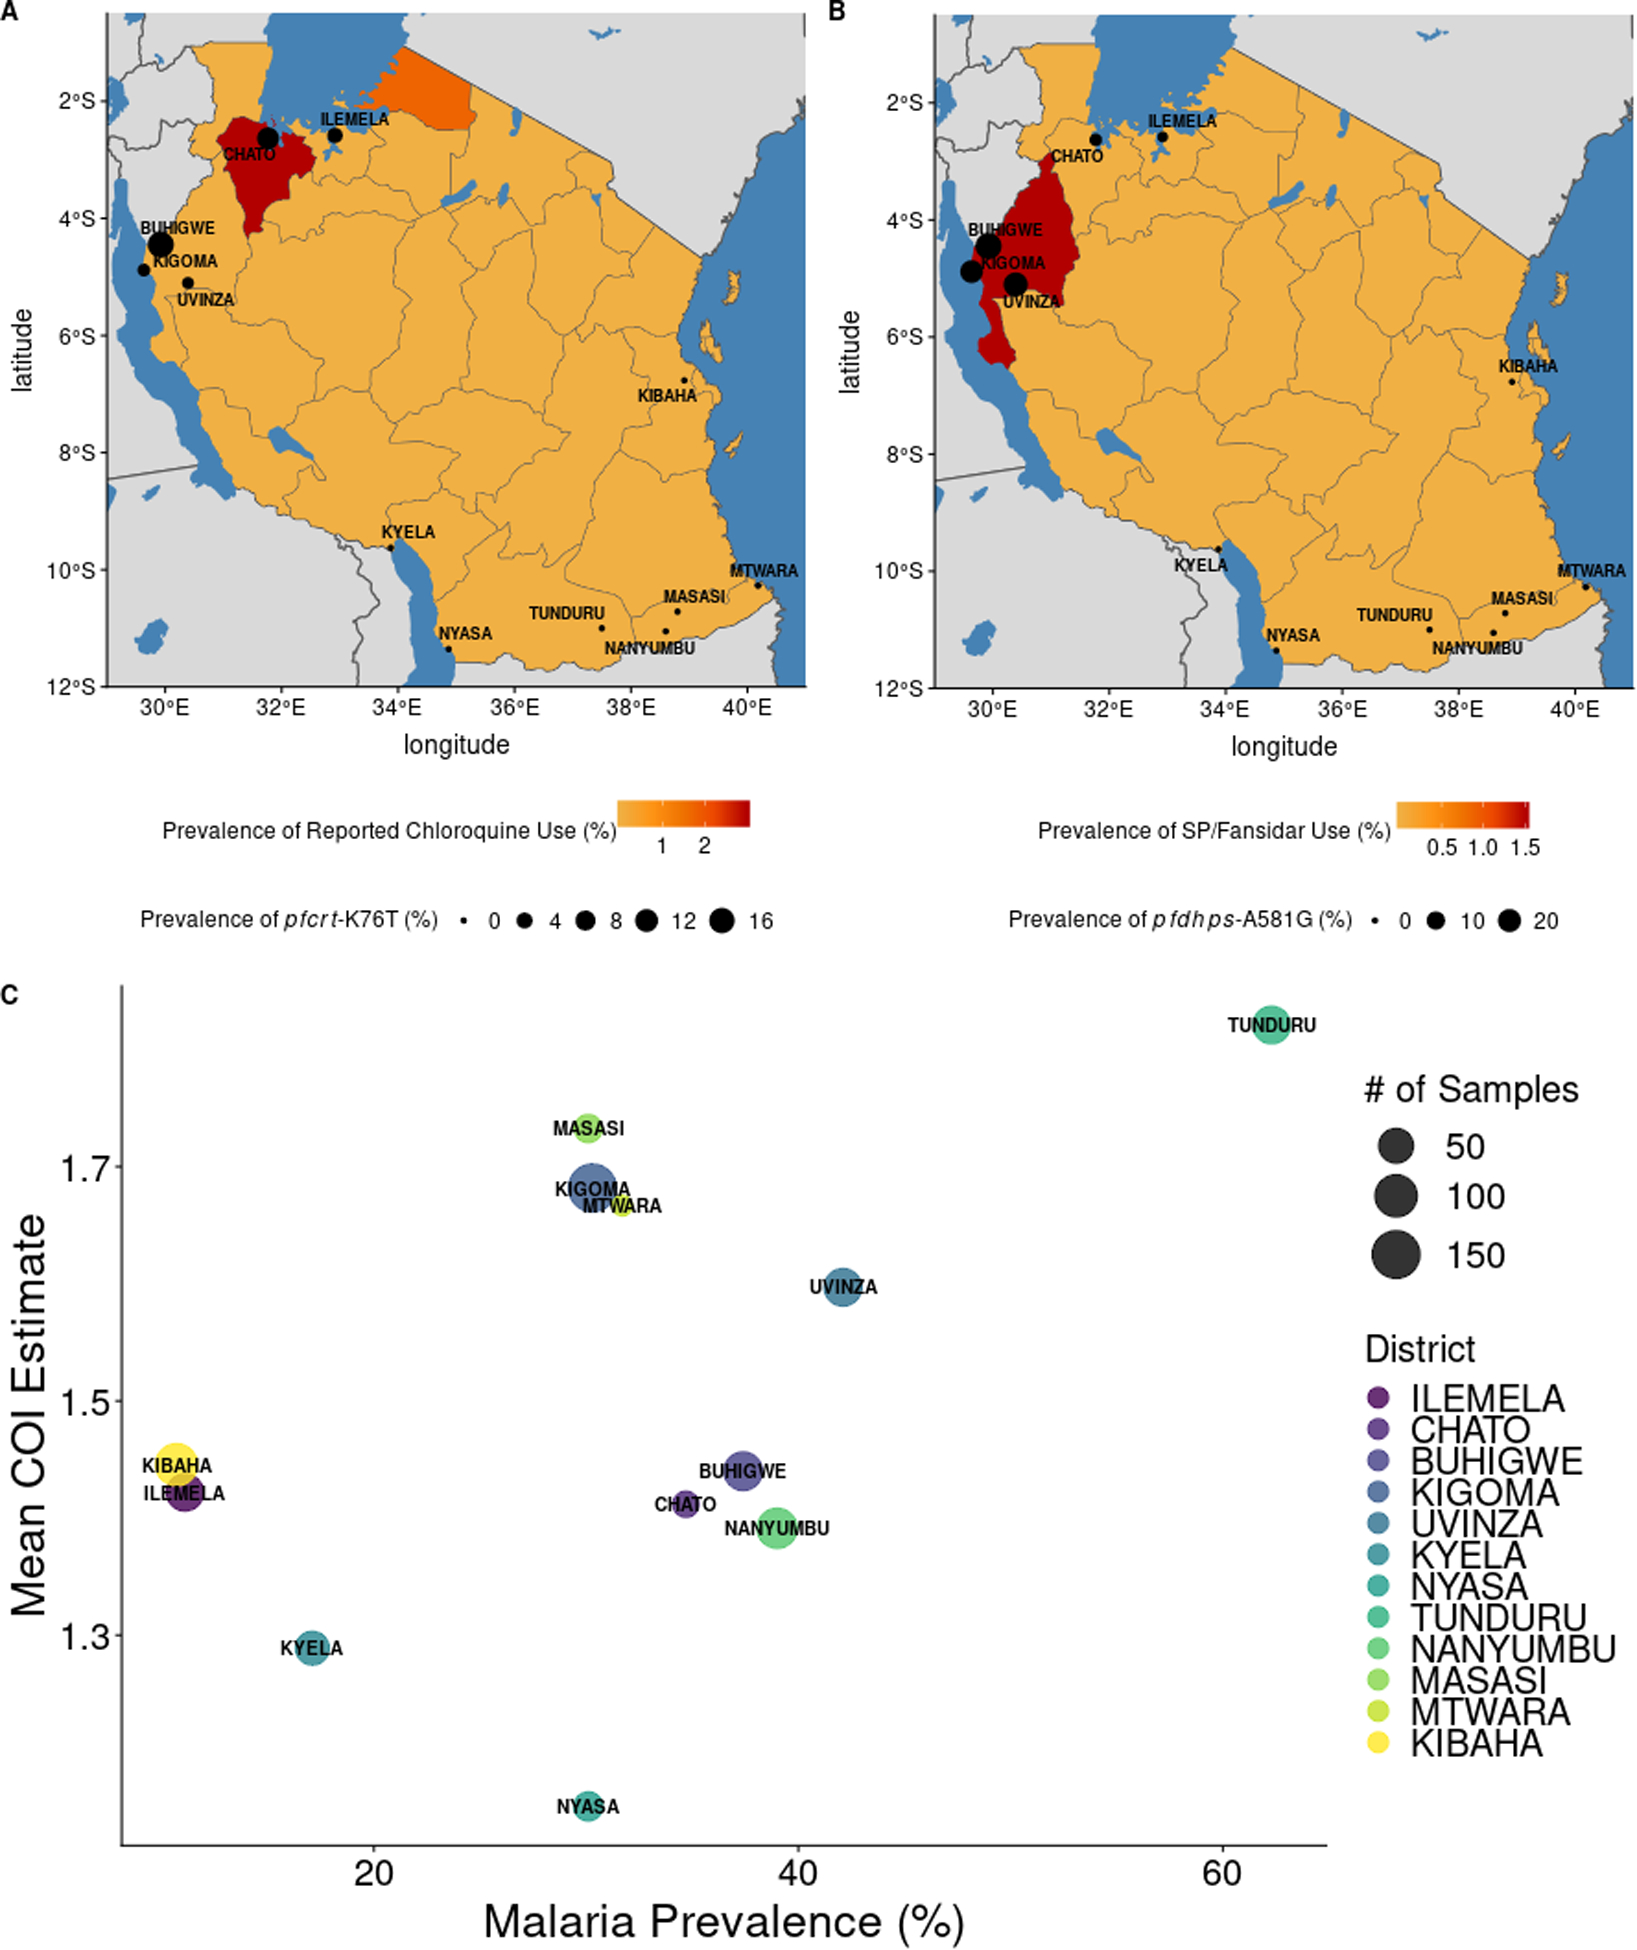
Figure 5:

Patterns of antimalarial use and malaria transmission with genetic measures. Data from the 2017 Malaria Indicator Survey (MIS) was assessed for correlation with genetic measures from this study. A. District level prevalences of pfcrt-K76T are presented on region-level estimates of chloroquine use among children under five years of age. Mutation frequencies for A. and B. can be found in Supplemental Dataset 1. B. District level prevalences of pfdhps-A581G are presented on region-level estimates of SP/Fansidar use among children under five years of age. C. The relationship between P. falciparum prevalence, as measured by rapid diagnostic tests (RDTs) in school-age children (Abt Associates, 2017), and average COI estimate, at the district level. Each point is a district, and the size of the district indicates how many samples were in each district.
