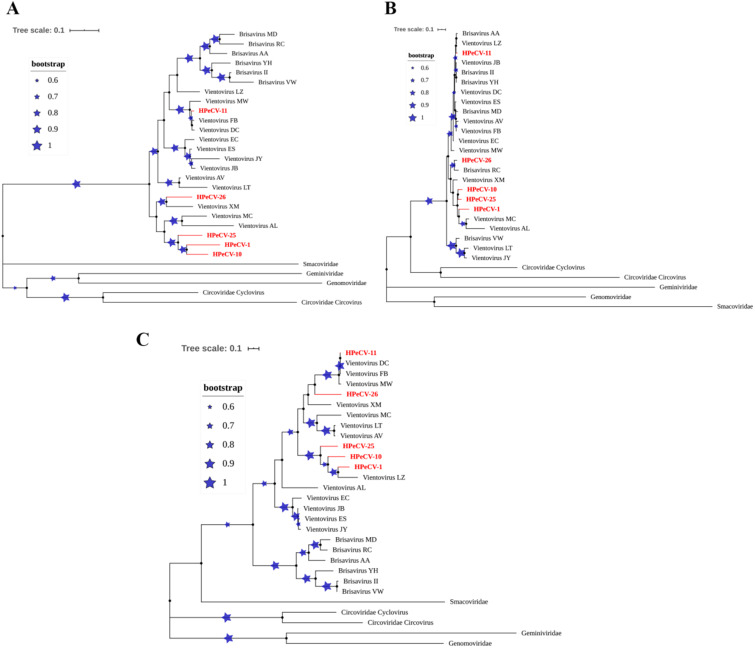
Figure 3.
Phylogenetic trees of novel HPeCVs formed using the ML method and 1,000 bootstrap replicates. The blue stars with branches represent the bootstrap values. The novel HPeCVs are colored red. (A) Complete nucleotide sequences, using Tamura-Nei model; (B) Capsid protein sequences, using Le_Gascuel_2008 model; (C) Rep protein sequences, and Le_Gascuel_2008 model.

