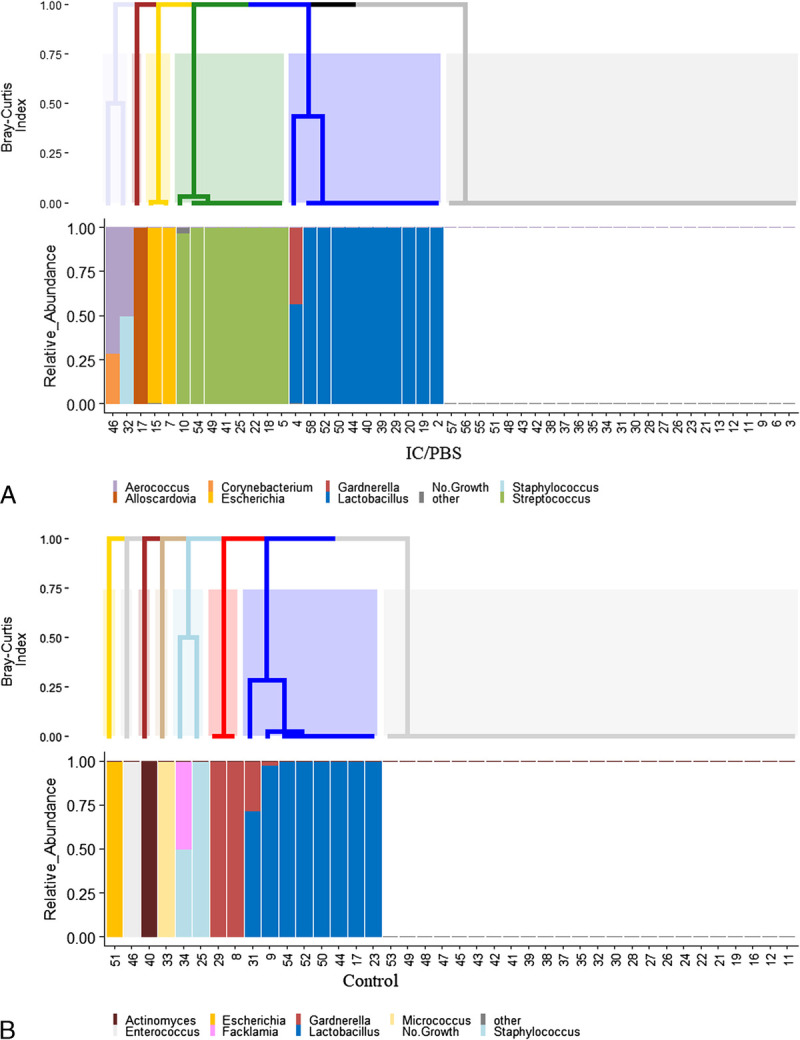
FIGURE 2.

Urotypes in the IC/PBS (A) and control (B) cohorts as determined by EQUC. Dendrogram produced using the Bray-Curtis index (top). Histogram showing relative abundance for each specimen (bottom).

Urotypes in the IC/PBS (A) and control (B) cohorts as determined by EQUC. Dendrogram produced using the Bray-Curtis index (top). Histogram showing relative abundance for each specimen (bottom).