
Figure 3.
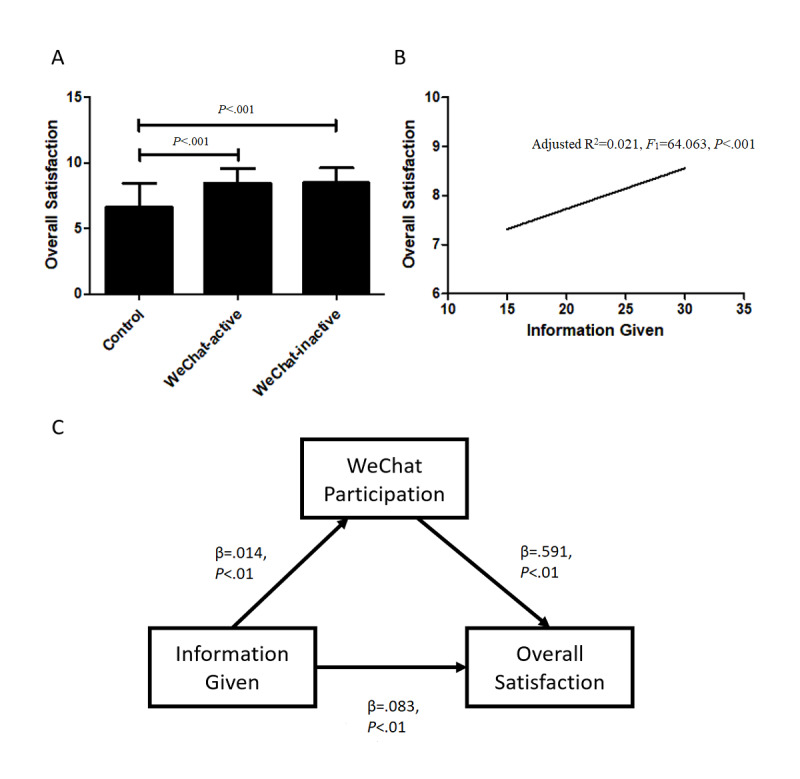
Data analysis from the Danish Health and Medicine Authority 2006 questionnaire. (A) Histogram shows higher overall satisfaction in active patients and inactive patients in the WeChat group than in the control group. (B) Linear regression between overall satisfaction and information given. (C) The mediated effect model among information given, WeChat participation, and overall participation.