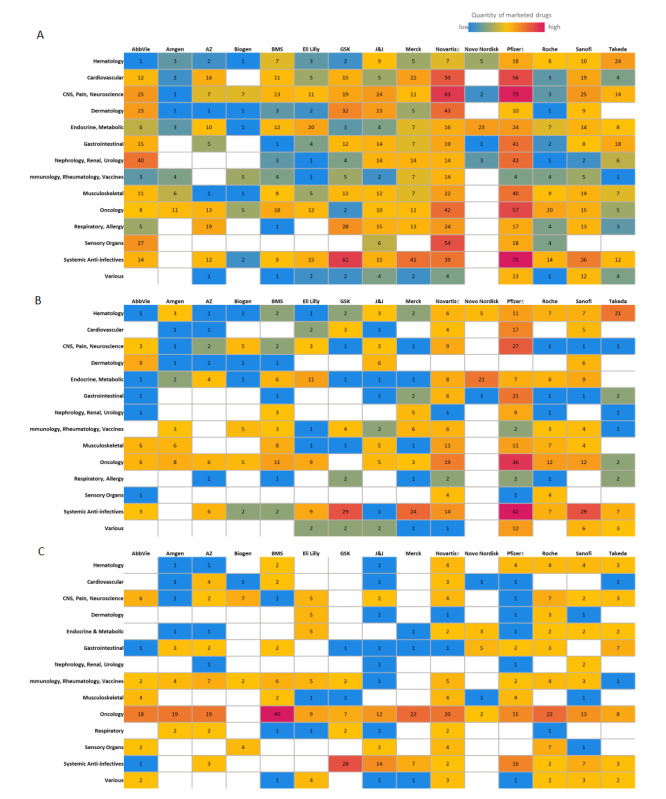
Figure 3.

Biopharma portfolios and pipeline by therapeutic areas. Heatmaps showing (A) marketed molecules across all routes of administration, (B) marketed injectable molecules, and (C) phase I to III pipeline molecules proposed for injectable administration. Biopharma pipeline assessment for the US market was conducted via the EvaluatePharma database as of October 1, 2020. Therapeutic areas defined in this paper were standardized across each biopharmaceutical company. For Novartis and Pfizer, generic manufacturing has been included in the count.
