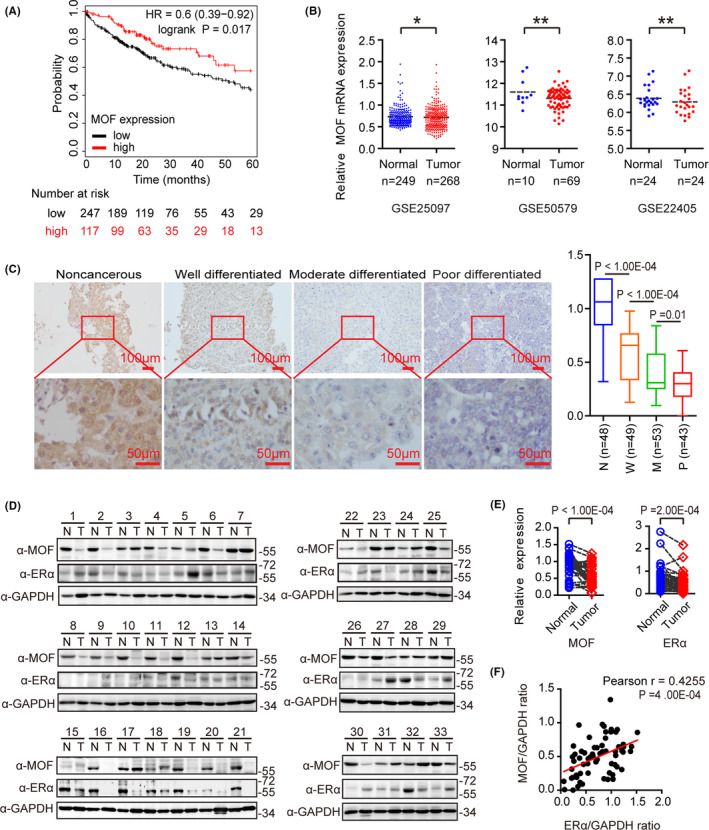
FIGURE 1.

MOF is lower expressed in hepatocellular carcinoma and positively correlated with ERα. A, The overall survival curve generated from the Kaplan‐Meier plotter website shows the contribution of MOF to 364 liver cancer patients. B, MOF mRNA expression from GSE25097, GSE50579, GSE22405 datasets was analyzed. C, MOF expression of different degrees of differentiation was shown by immunohistochemical staining in clinical specimens. N: noncancerous liver tissue; W: well differentiated HCC; M: moderately differentiated HCC; P: moderately differentiated HCC; magnification: ×10×40; scale bars: 100 μm/50 μm. Mann‐Whitney U test was used. D, Protein expression of MOF or ERα in 33 pairs of HCC (T) and adjacent non‐tumor tissues (N) was analyzed using western blot. E, Using the gray‐scale expression of MOF or ERα in Figure 1D and GAPDH as a reference, a two‐tailed Student t test was used for statistical analysis. F, There is a positive correlation between MOF and ERα protein expression. The expression levels of MOF and ERα in Figure 1D were quantified by densitometry, standardized with GAPDH, and analyzed by Pearson correlation. In the above experiments, *P < .05, **P < .01, and ***P < .001
