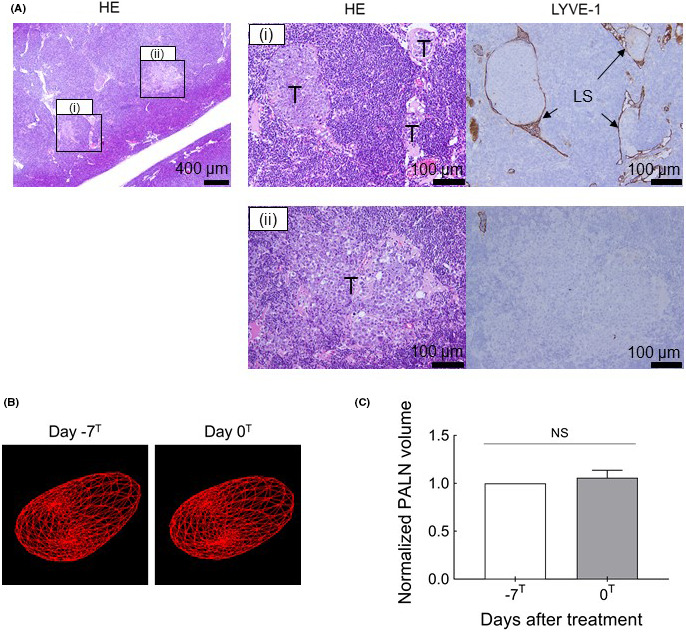
FIGURE 1.

Histopathological images of the proper axillary lymph node (PALN) immediately before the therapeutic intervention. A, The HE‐stained and LYVE‐1–immunostained sections on the right correspond to regions (i) and (ii) in the HE‐stained section on the left. (i) Tumor infiltration and growth were observed in the lymph node (LN). Tumor cells had grown along the lymphatics to fill the lymphatic sinuses as tumor emboli. Furthermore, the proliferating tumor had destroyed the structure of the lymphatic sinus and infiltrated the LN parenchyma. (ii) LYVE‐1–positive cells were not detected, indicating destruction of the lymphatic sinus endothelium. LS, lymphatic sinus; T, tumor cells. Scale bars: 400 µm and 100 µm. B, Three‐dimensional reconstruction of the high‐frequency ultrasound system (HF‐US) imaging data for the PALN at day −7T and day 0T. The segmented LN borders are shown in red. C, PALN volume normalized to the value at day −7T. There was no significant difference in PALN volume between days −7T and 0T (paired t test). Data are presented as mean ± SEM (n = 6). NS: not significant
