
FIGURE 4.
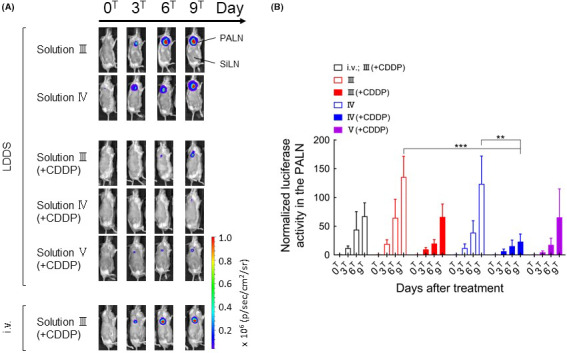
Changes in bioluminescence intensity over time after the administration of cisplatin (CDDP) using the lymphatic drug delivery system (LDDS). A, Representative bioluminescence images showing luciferase activity. B, Luciferase activity in the proper axillary lymph node (PALN) normalized to the value at day 0T. Bioluminescence intensity at day 9T was significantly lower in the IV(+CDDP) group than in the III or IV groups (two‐way ANOVA and Tukey’s test: ***P <.001, III vs IV[+CDDP]; **P <.01, IV vs IV[+CDDP]). There were no statistically significant differences in the bioluminescence intensity among III(+CDDP), IV(+CDDP), and V(+CDDP) at day 9T. Data are presented as the mean ± SEM (i.v. III[+CDDP], n = 6; III, n = 6; III[+CDDP], n = 7; IV, n = 6, IV[+CDDP], n = 6; V[+CDDP], n = 4)