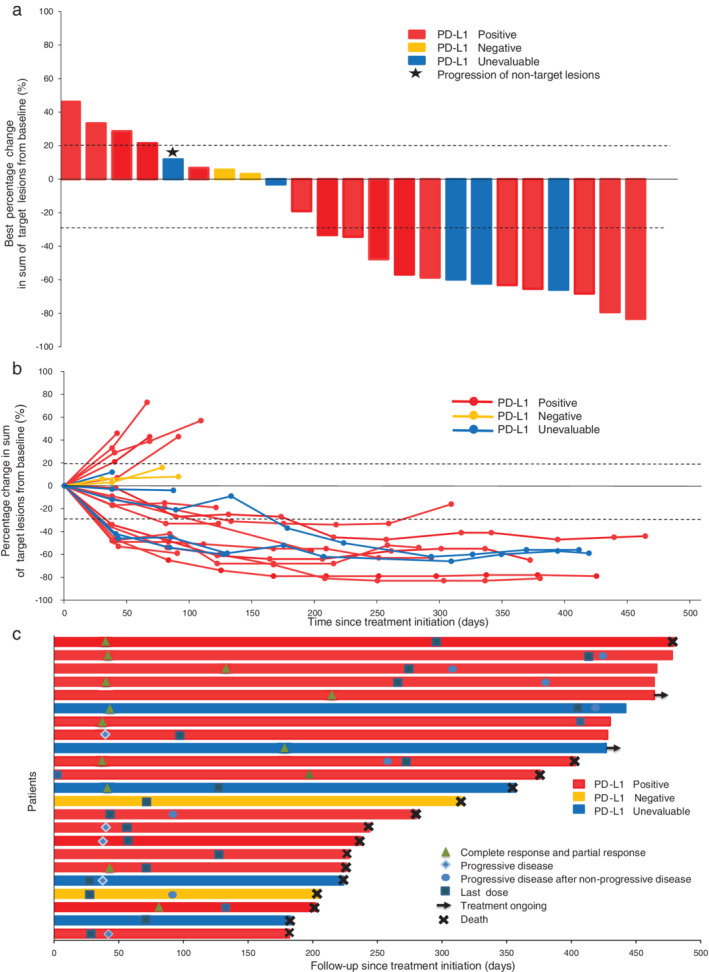
FIGURE 1.

Activity of the study treatment. (a) Best change of target lesions from baseline. The asterisk indicates progression of nontarget lesions. (b) Longitudinal change of target lesions from baseline. (c) Treatment period and duration of response. The length of each bar represents the time to the last follow‐up
