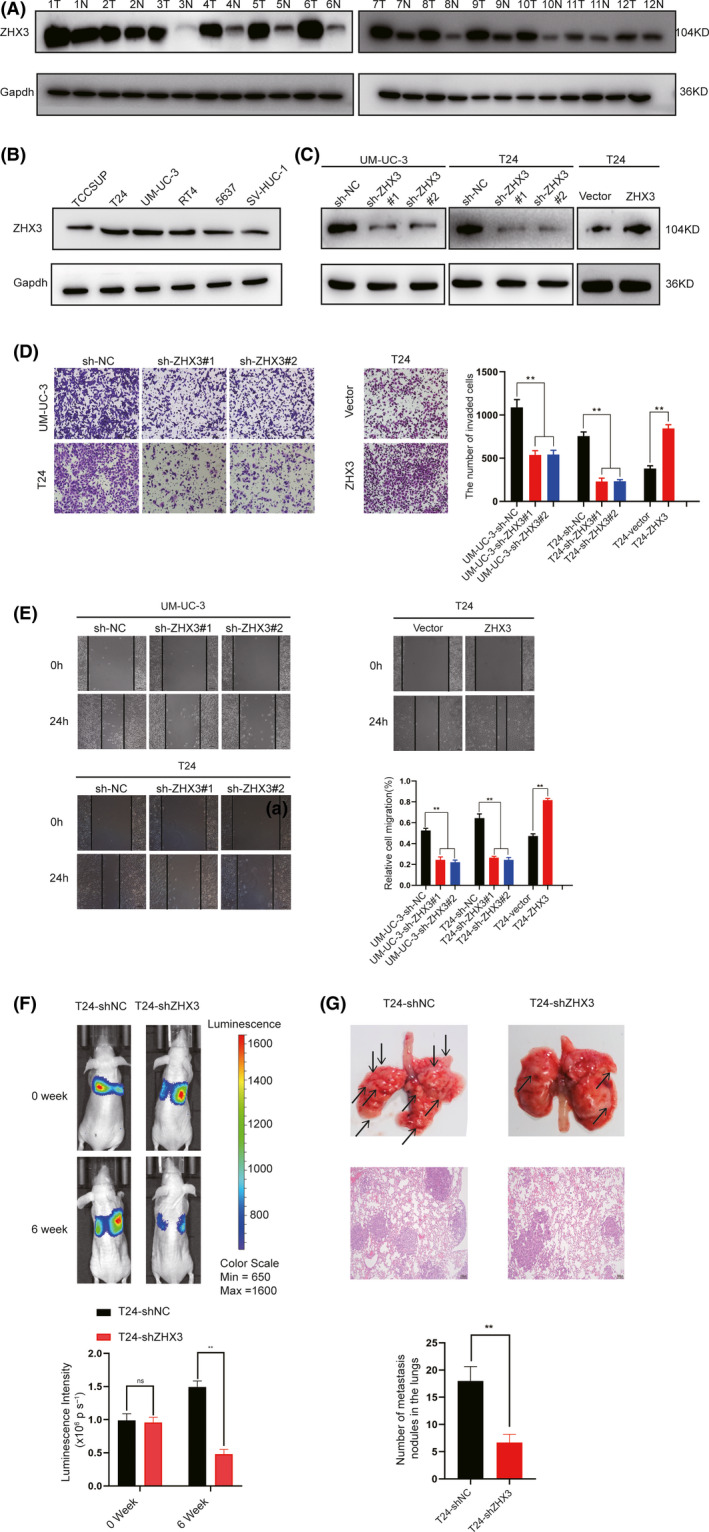
FIGURE 3.

The levels of ZHX3 expression were consistent with the tumorigenic activity of UCB cells. A, ZHX3 expression in 12 pairs of UCB tissues. N, non‐neoplastic bladder tissues; T, tumor tissue. Gapdh was used as a loading control. B, Expression levels of ZHX3 in five human UCB cell lines (ie, TCC‐SUP, T24, UM‐UC‐3, BIU, RT4, and 5637) and 1 normal uroepithelial cell line, SV‐HUC‐1. Gapdh was used as a loading control. C, ZHX3 was efficiently knocked down or overexpressed in the corresponding cells by western blotting. D, Transwell assays show that the invasive capacity of UCB cells was inhibited when ZHX3 was knocked down. However, overexpression of ZHX3 cells had a higher invasive capacity compared with T24‐Vector cells. Error bars indicate the means ± standard deviation (SD) of 3 independent experiments. **P < .01. E, Wound‐healing assays show that the migration capacity of UCB cells was inhibited when ZHX3 was silenced. F, Silencing ZHX3 inhibited the metastatic ability of T24 cells in mouse models (6 mice per group). Bioluminescence imaging was performed at 0 and 6 wk after injection for each mouse. Representative bioluminescent images are shown. The mean bioluminescent signals are shown in the column. Error bars indicate the mean ± SD. ns: negative significance, **P < .01. G, Representative lung metastatic nodules (indicated by arrows) and H&E staining of lung tissue are shown (original magnification: ×100; scale bar: 100 µm). Lung tissue was taken from the mice at 6 wk after injection of UCB cells. ns: negative significance. **P < .01. Error bars indicate the mean ± SD
