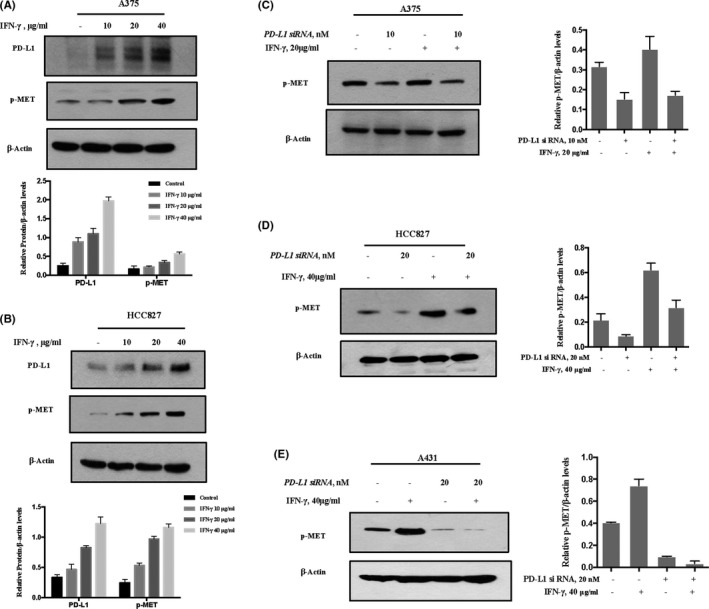
FIGURE 3.

IFN‐γ‐induced PD‐L1 expression promotes MET phosphorylation. A, B, The cells were treated with various concentrations of IFN‐γ for 36 h, and PD‐L1 expression and MET phosphorylation were measured by western blot. A375 (A), HCC827 (B). C‐E, Effect of PD‐L1 inhibition on IFN‐γ‐induced MET phosphorylation in A375 (C), HCC827 (D) and A431 (E). Cells were treated with 40 μg/mL IFN‐γ after the cells were transfected with either PD‐L1 siRNA or control siRNA for 48 h, and the changes of MET phosphorylation were analyzed by western blot. Bands were quantified using ImageJ software and quantitative data are presented as mean ± SD based on 3 biological replicates
