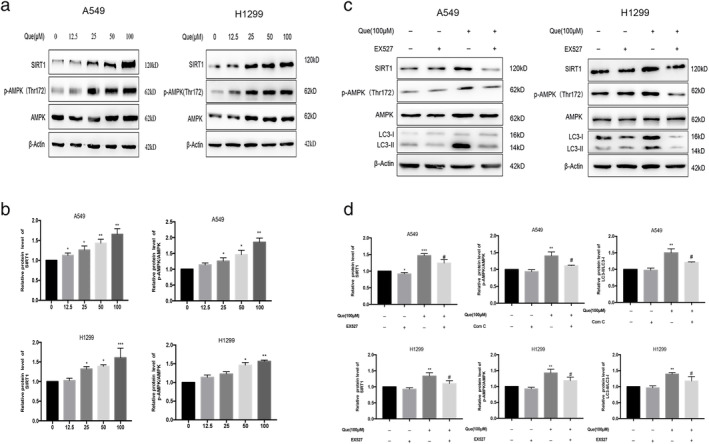
FIGURE 4.

Que activated SIRT1/AMPK signaling in A549 and H1299 cells. (a,b) A549 and H1299 cells were treated with different concentrations of Que for 24 hours, and western blot analysis was used for analyzing the expression of SIRT1 and p‐AMPK/AMPK. (c,d) A549 and H1299 cells were treated with 100 μM Que with or without cotreatment with 10 μM EX527 for 24 hours, and western blot analysis was used for analyzing the expression of SIRT1, p‐AMPK/AMPK, and LC3‐II. Columns indicate mean ± SD of three experiments,* p < 0.05, ** p < 0.01 versus respective control cells, # p < 0.05 versus Que
