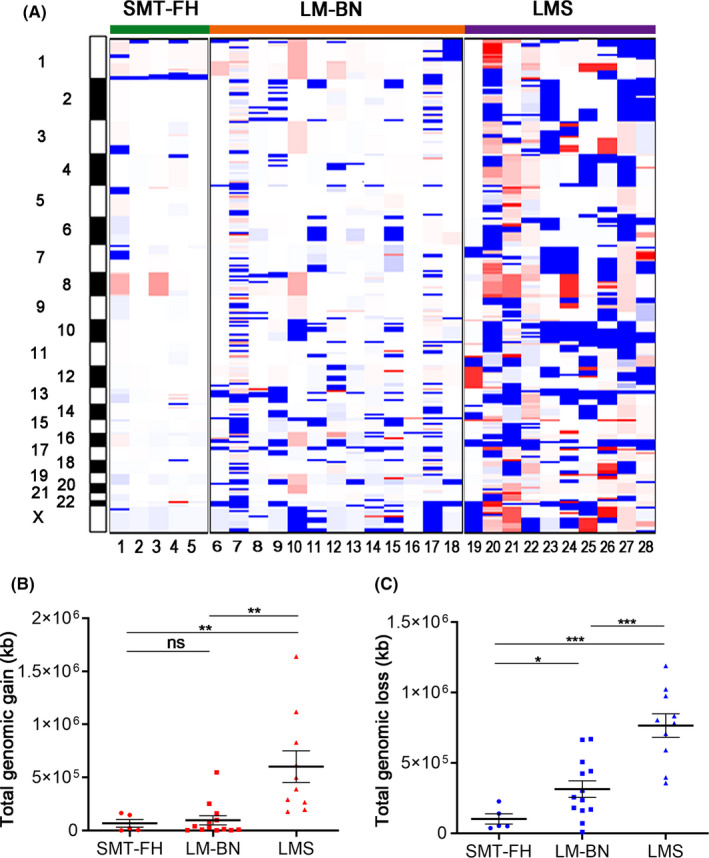
FIGURE 2.

Genomic copy number alterations (CNAs) analysis of SMT‐FH, LM‐BN, and LMS. A, Copy number gains (red) and losses (blue) were displayed for 5 SMT‐FH, 13 LM‐BN and 10 LMS (x‐axis: tumor type; y‐axis: chromosomal location). B and C, Quantitation of the total base length of gains (B) and losses (C) by tumor types were shown. Error bars represent the standard error of the mean. *P < .05; **P < .005; ***P < .001; n.s., not significant
