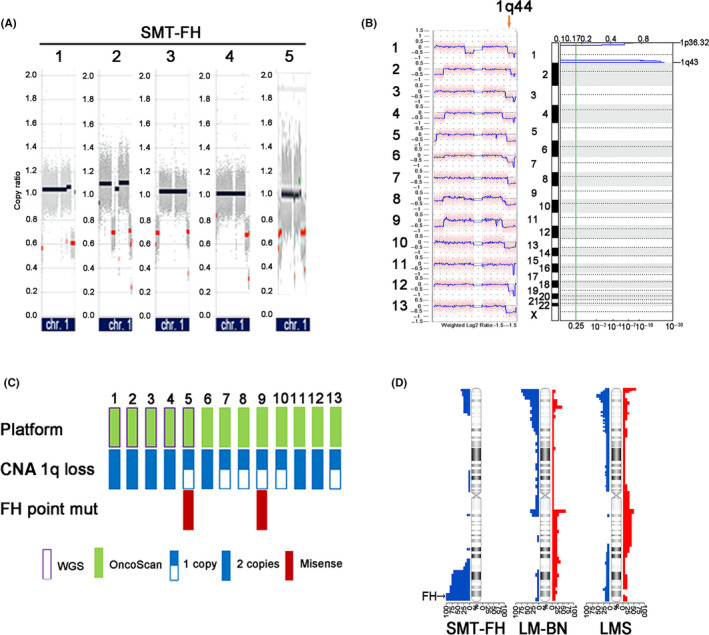
FIGURE 3.

Genomic alterations in SMT‐FH. A, CNA plots of chr1 in 5 SMT‐FH analyzed by WGS. Red dots indicate the regions of copy number loss. B, CNA plots of chr1 as analyzed by Affymetrix OncoScan® microarrays in 13 SMT‐FH (left panel) and significant copy number losses analyzed by GISTIC v.2.0. (right panel). C, Integrated representation of copy number losses on chromosome 1 in 13 SMT‐FH analyzed on 2 platforms and FH mutation analysis. D, CNA plot on chromosome 1 in SMT‐FH, LM‐BN, and LMS tumors. Blue color (left) indicated loss and red gain (right)
