
FIGURE 4.
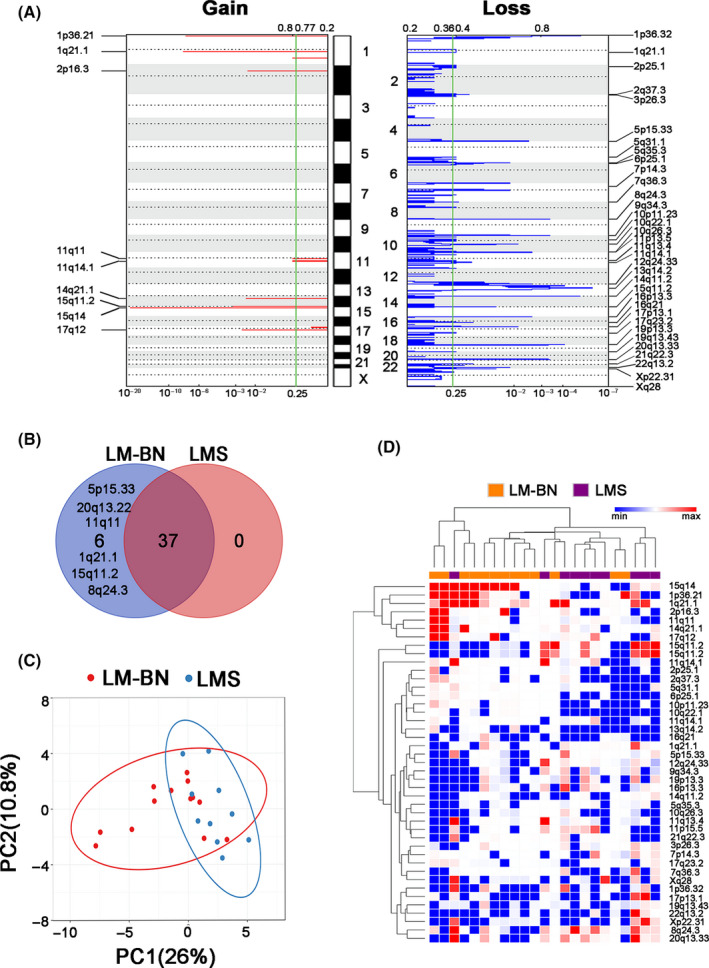
CNA analysis in LM‐BN and LMS. A, GISTIC analysis of significant copy number gain (left) and loss (right) in chromosomal regions in both LM‐BN and LMS (x‐axis: q‐values). B, Venn diagram showing the distribution of significant focal CNAs in LM‐BN, LMS and both. C, Scatter plot of principal component analysis (PCA) of LM‐BN (n = 13) and LMS (n = 10) samples. Each sample is represented as a colored point (red, LM‐BN; blue, LMS), and the axes reflect the first 2 PCs. D, Heatmap dendrogram of significant focal CNAs (row, gain red; loss blue) for each analyzed sample (column) of LM‐BN (orange) and LMS (purple). Dendrogram arm length is inversely proportional to the relatedness of the involved cluster