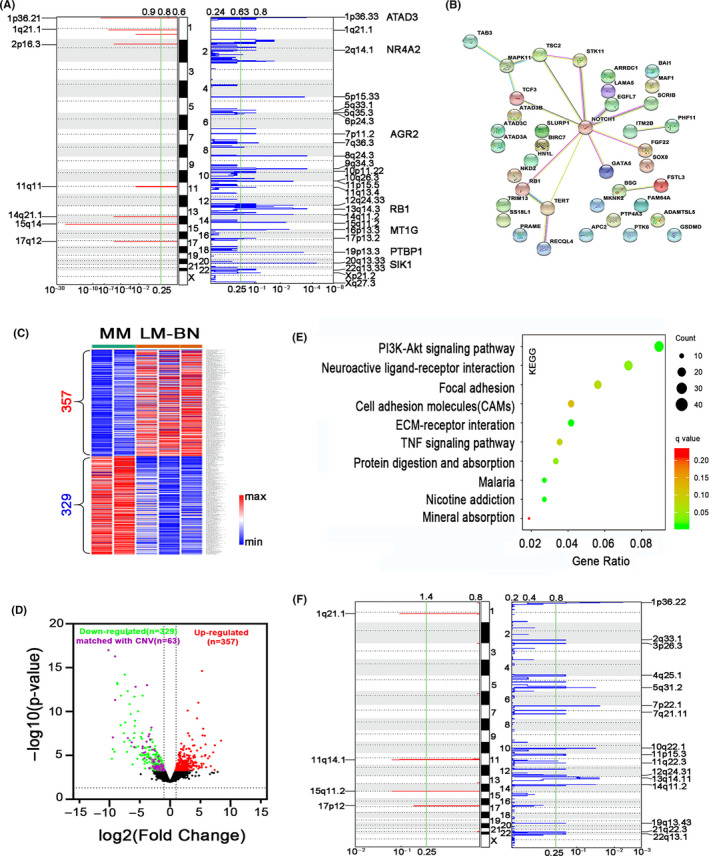
FIGURE 5.

Gene alteration analysis in LM‐BN. A, GISTIC analysis of significant copy number gain (left) and loss (right) in chromosomal regions in LM‐BN (x‐axis: q‐values). B, Network graph showing topological relationship of 39 cancer‐associated genes centered on NOTCH1 from common CNA regions detected by GISTIC 2.0 analysis in LM‐BN. C, Heatmap illustrates 686 dysregulated genes in LM‐BN by RNA‐seq analysis, compared with myometrial controls (MM). D, Volcano plot showing the distribution of downregulated (green) and upregulated (red) genes in LM‐BN. Purple dots indicate downregulated genes in the regions of common copy number loss. E, Altered pathways by enrichment analysis in GO annotation (KEGG) for CNA (729 genes) and RNA‐seq (686 genes) in LM‐BN. F, GISTIC analysis of significant copy number gain (left) and loss (right) in chromosomal regions in LMS (x‐axis: q‐values)
