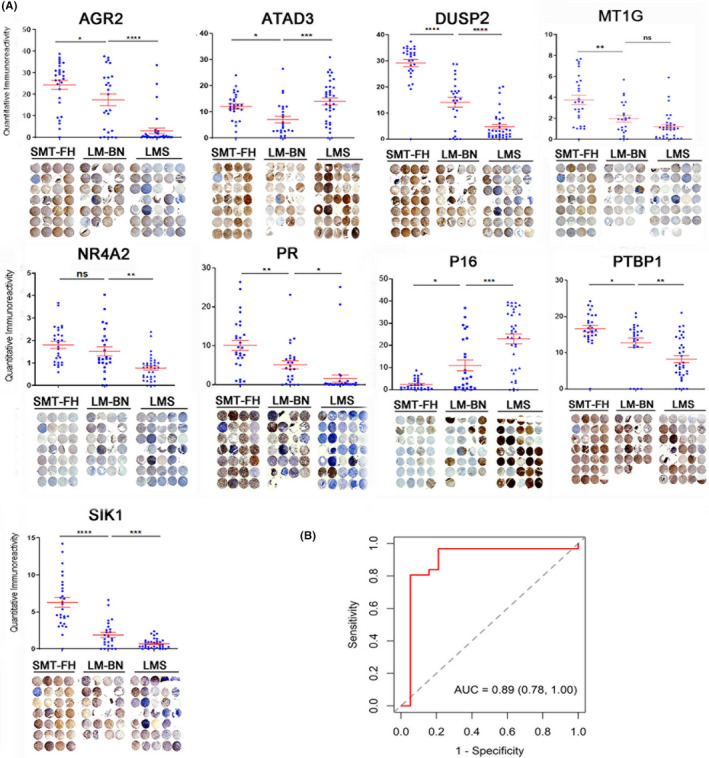
FIGURE 6.

Immunohistochemistry analysis of the selected biomarkers in SMT‐FH, LM‐BN, and LMS. A, Immunohistochemical analysis of 9 biomarkers in 3 different tumors. Dot plot (upper) summarizes the quantitative scores of immunointensity using ImageJ software (see Materials and Methods). Red bars indicated mean and standard errors. Each dot represents one sample. *P < .05; **P < .005; ***P < .001; n.s., not significant. Tissue microarray (bottom) illustrates the actual immunostain (brown color) with counterstain of hematoxylin (blue color) in 3 tumor types. Cores that did not have sufficient tissue for an IHC score are marked with a red cross. B, ROC curve for optimal combination of IHC biomarkers. A receiver operating characteristic (ROC) curve for discriminating LMS from LM‐BN was constructed using the linear predictors from a logistic regression model and combining all 8 significant IHC biomarkers. The optimal combination of 6 biomarkers was selected using the LASSO algorithm. Leave‐one‐out cross‐validation was used on this optimal model to estimate out‐of‐sample performance and prevent overfitting
