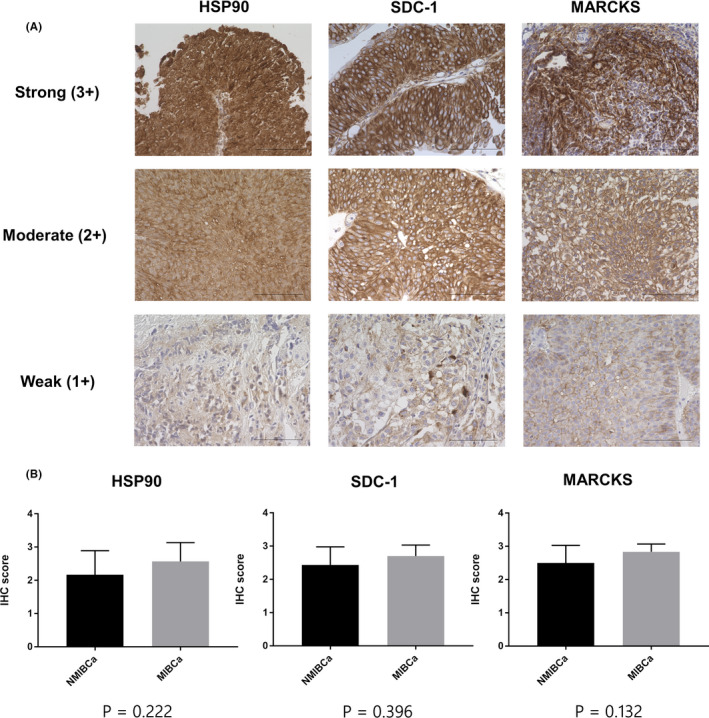
FIGURE 6.

Immunohistochemical analysis of BCa. A, Typical patterns of strong (+3), moderate (+2), and weak (+1) staining of HSP90, SDC1, and MARCKS (scale bars, 100 μm). B, Comparison of IHC scores of HSP90, SDC1, and MARCKS between NMIBCa and MIBCa tissues. Data are presented as mean with SD. BCa, bladder cancer; HSP90, heat‐shock protein 90; MIBCa, muscle‐invasive bladder cancer; MARCKS, myristoylated alanine‐rich C‐kinase substrate; NMIBCa, non‐muscle‐invasive bladder cancer; SDC1, syndecan‐1
