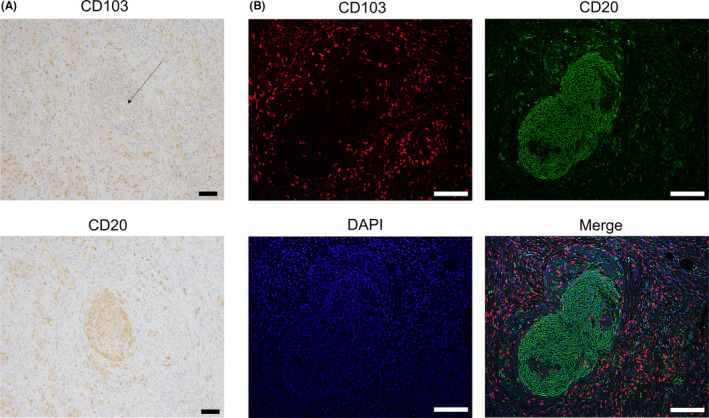
FIGURE 7.

Distribution of CD103+ T cells and CD20+ B cells in tumor tissues of GC with immunohistochemical and immunofluorescence staining. A, Representative images of CD103 and CD20 immunostaining of the same tumor area are shown. Scale bars, 50 μm. B, Representative images of immunofluorescence staining of CD103 (red), CD20 (green), and DAPI (blue) are shown. CD103+ T cells were observed around CD20+ B cell aggregates, which were considered TLSs. Scale bars, 50 μm
