
FIGURE 1.
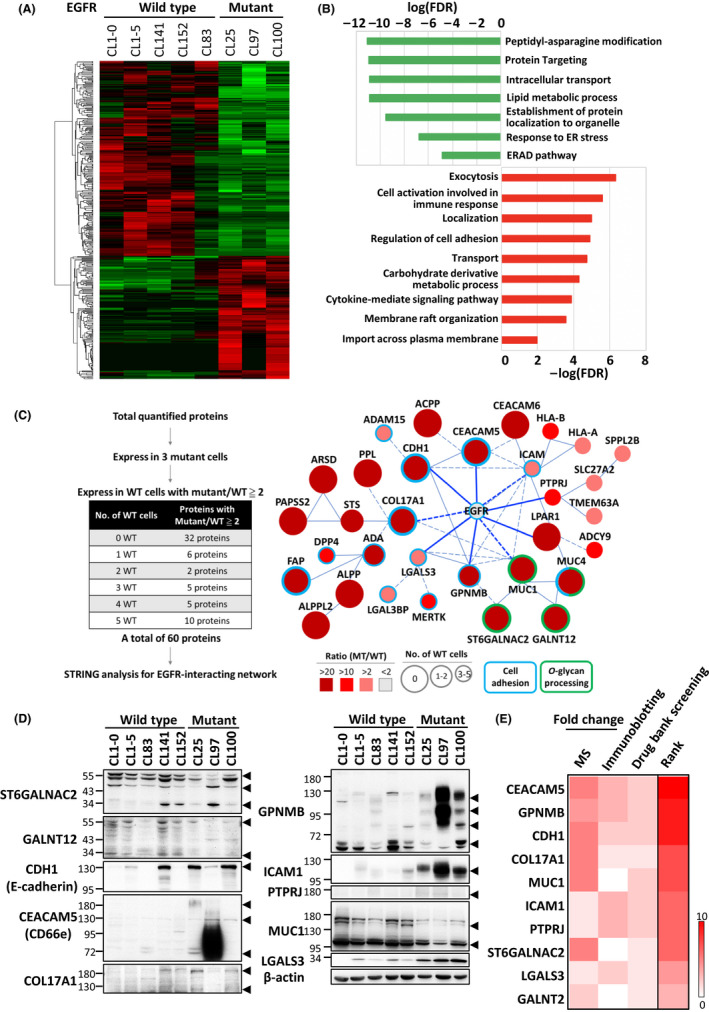
Altered membrane protein profiling associated with EGFR‐mutant NSCLC. A, Heat‐map and clustering analysis of 361 differentially expressed proteins in EGFR‐wild‐type and EGFR‐mutant NSCLC cells by membrane proteomic analysis. B, Functional analyses of the upregulated (red) and downregulated (green) proteins in mutated EGFR cells. C, Enriched network in EGFR‐mutant NSCLC. Left: Filtering criteria of the input proteins to build a network of mutated EGFR. Right: The mutated EGFR network conducted using the STRING database (blue: cell adhesion; green: O‐glycan processing; solid line: interaction with experimental confirmation,;dotted line: predicted interaction). The area of each protein represents the number of wild‐type cancer cells in which the identified protein occurred; the color indicates the ratio of protein expression (mutant/wild‐type). D, Validation of 10 candidates randomly selected from Figure 1C. Arrowheads point to the bands of the indicated protein. E, Ranking of the 10 selected candidates