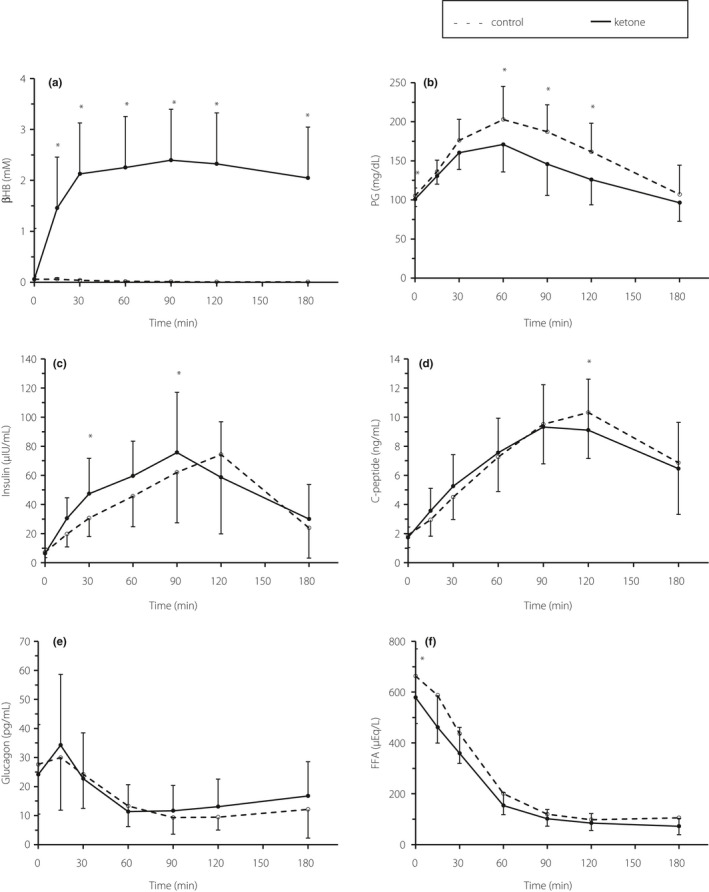
Figure 2.

Temporal changes in blood parameters during a 75‐g oral glucose tolerance test. (a) D‐beta‐hydroxybutyrate (βHB), (b) plasma glucose, (c) insulin, (d) C‐peptide, (e) glucagon and (f) free fatty acids (FFA). The dotted lines indicate the control condition, and the solid lines indicate the ketone condition. Each datapoint indicates the mean value ± standard deviation with n = 9, except n = 8 for insulin at 180 min. *P < 0.05, significant difference between the conditions.
