

Abstract
Aims/Introduction
A low insulin secretion capacity has been implicated in the high prevalence of non‐obese diabetes in East Asians. As alcohol consumption alters insulin and glucose metabolism, we tested the hypothesis that alcohol consumption contributes to impaired insulin secretion and glucose intolerance in lean/normal‐weight non‐diabetic Japanese men.
Materials and Methods
This cross‐sectional study was undertaken among the residents of Shika town, Japan, between 2011 and 2017. A total of 402 non‐diabetic men, including participants with normal fasting plasma glucose (FPG) and impaired FPG (FPG 5.6–6.9 mmol/L), and aged ≥40 years, were examined. FPG, the homeostasis model assessment of insulin secretion capacity (HOMA‐B) and alcohol consumption were evaluated and compared between the body mass index (BMI) <25 and BMI ≥25 groups.
Results
HOMA‐B levels were lower in the BMI <25 group than in the BMI ≥25 group. Alcohol consumption correlated with a low HOMA‐B level regardless of BMI, and, thus, the HOMA‐B levels of alcohol drinkers were significantly lower in the BMI <25 group. A multivariable logistic regression analysis showed that alcohol consumption, even light‐to‐moderate consumption (1–25 g/day), was associated with significantly low levels of HOMA‐B and impaired FPG in the BMI <25 group. Among participants with impaired FPG, a low level of HOMA‐B was observed in alcohol drinkers, but not in non‐drinkers. In contrast, light‐to‐moderate alcohol consumption was not related to HOMA‐B or FPG in the BMI ≥25‐group.
Conclusion
Alcohol consumption, even a small amount, might contribute to reductions in HOMA‐B levels and impaired FPG in lean/normal‐weight Japanese men.
Keywords: Alcohol drinking, Body size, Insulin secretion
Moderate alcohol consumption was associated with significantly low levels of insulin secretion capacity and impaired fasting plasma glucose in the body mass index (BMI) <25 group. However, these associations were not observed in the BMI ≥25 group. The associations between alcohol consumption and insulin and glucose metabolism were more pronounced among men with lower BMI than higher BMI.
Introduction
In the past two decades, alcohol consumption per capita has increased as a result of economic growth in many lower‐middle income countries, including Asian countries 1 . In contrast, alcohol consumption has decreased in western European countries, Korea and Japan 1 . Although changes in alcohol consumption vary among countries, the prevalence of type 2 diabetes mellitus has markedly increased worldwide. Many studies have investigated the relationship between alcohol consumption and type 2 diabetes mellitus 2 , 3 , 4 , 5 , 6 , 7 , 8 , 9 , 10 , 11 , 12 , 13 . However, it currently remains unclear whether alcohol consumption increases or decreases the risk of type 2 diabetes mellitus.
Previous epidemiological studies reported that moderate alcohol consumption is a protective factor against the development of type 2 diabetes mellitus 2 , 3 . The beneficial effects of moderate alcohol consumption on glucose metabolism have been proposed as one of the main explanations for this relationship. A negative relationship was shown between alcohol consumption and insulin secretion, suggesting that insulin resistance is decreased by alcohol consumption 4 , 5 . In contrast, alcohol and its metabolites have been shown to induce abnormal reductions in insulin secretion and dysfunction in pancreatic β‐cells 6 , 7 , 8 , 9 , 10 . Furthermore, some studies carried out in East Asian countries did not observe risk reductions in the development of type 2 diabetes mellitus with moderate alcohol consumption 11 , 12 , 13 .
A low insulin secretory capacity is a characteristic of glucose metabolism in East Asians 14 , 15 . The prevalence of obesity is markedly lower in these countries than in Western countries, because insulin is the principal hormone regulating not only glucose metabolism, but also fatty acid metabolism and body fat accumulation. Obesity is a key risk factor for the development of impaired glucose tolerance and type 2 diabetes mellitus. However, the International Diabetes Federation reported that approximately 55% of diabetes patients are Asian. In Japan, 63.9% of diabetes patients are neither obese nor overweight 16 . A low insulin secretory capacity has been implicated in the high prevalence of non‐obese diabetes in lean/normal‐weight East Asians 14 , 15 .
We hypothesized that alcohol consumption impairs insulin secretion and results in glucose intolerance in lean/normal‐weight East Asians. We examined the relationships between alcohol consumption and fasting plasma glucose (FPG), glycated hemoglobin (HbA1c), insulin resistance and insulin secretory capacity in non‐diabetic Japanese men, and compared these relationships between BMI groups.
Methods
Study design and participants
The Shika cohort study has been carried out among the residents of Shika town, Japan, since 2011. This cross‐sectional study was carried out using data from the Shika study. Shika town, a coastal suburb town, located in the middle of the Noto peninsula, Ishikawa prefecture, Japan, and its population in 2015 was 21,666. The study enrollment procedure is outlined in Figure 1. All 5,013 residents aged ≥40 years and living in four specific elementary school districts of Shika town were targeted for the Shika study. Questionnaires were sent between 2011 and 2015, and 4,259 were answered and returned. Comprehensive medical examinations were called for 4,259 participants; 1,191 were voluntary collaborators and underwent a medical examination between 2013 and 2017, whereas 3,068 did not. A total of 789 participants were excluded for the following reasons: women (n = 632), incomplete questionnaire and examination data (n = 35), having diabetes mellitus (receiving medical treatment for diabetes mellitus, FPG ≥7.0 mmol/L and/or HbA1c ≥6.6%; n = 87), and receiving medication for cardiovascular disease (n = 14), cerebrovascular disease (n = 6), cancer (n = 12), hepatobiliary disease (n = 2) and end‐stage chronic renal failure (n = 1). The details of the Shika study have been described previously 16 . The study protocol was designed in accordance with the Declaration of Helsinki and was approved by the institutional review board of Kanazawa University (No. 1491, 18 December 2013).
Figure 1.
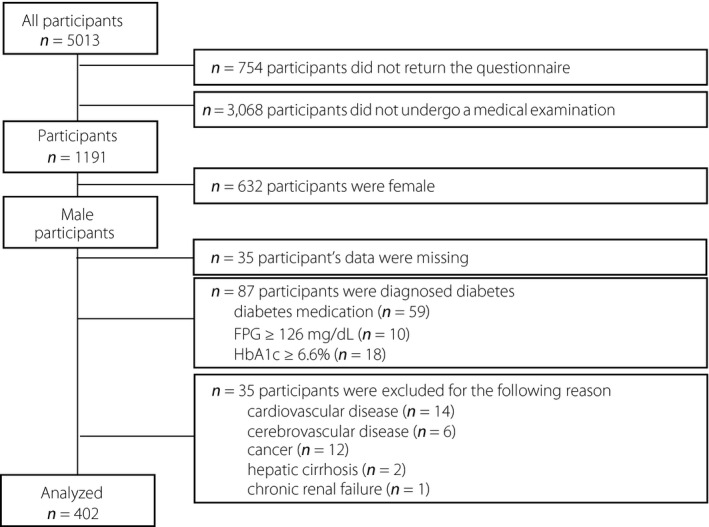
Flowchart for the recruitment of the participants.
Measurements
All measurements were carried out at the comprehensive medical examination. To measure FPG, insulin, triglycerides and cholesterols, blood samples were collected from the antecubital vein after an overnight fast and analyzed within 24 h. These blood tests were outsourced to SRL, Inc. (Tokyo, Japan).
Fasting plasma glucose was measured by the hexokinase method using an ultraviolet spectrophotometer, whereas insulin levels were measured by using a chemiluminescent immunoassay. The latex aggregation immunoassay measured HbA1c levels. For preventing diabetes, the Japan Diabetes Society guidelines recommend considering FPG >5.55 mmol/L as “a group with a high risk for developing diabetes mellitus in the future” and HbA1c >6.0% as “suspected diabetes mellitus cannot be excluded.” Therefore, we used the cut‐off point of FPG and HbA1c on 5.6 mmol/L and HbA1c 6.0%, respectively.
Homeostasis model assessments (HOMA) were used to evaluate insulin resistance (HOMA‐IR) and β‐cell function (HOMA‐B). A detailed calculation was carried out using the following formula: HOMA‐IR = fasting plasma glucose (mmol/L) × fasting serum insulin (mU/L) / 22.5, HOMA‐B = 20 × fasting serum insulin (mU/L) / (fasting plasma glucose [mmol/L] − 3.5) 17 .
Total cholesterol, high‐density lipoprotein cholesterol and triglycerides concentrations were measured by the cholesterol esterase–cholesterol oxidase–peroxidase method, the direct measurement method using polyethylene glycol‐modified enzymes and sulfated alpha‐cyclodextrin, and the glycerol kinase–glycerol‐3‐phosphate method, including the endogenous glycerol‐eliminating step, respectively. These measurements of FPG, insulin, triglycerides and cholesterols were outsourced to SRL, Inc. low‐density lipoprotein cholesterol was calculated using the Friedewald equation. It was not possible to estimate low‐density lipoprotein cholesterol concentrations for seven participants with excessively high triglycerides values (≥140 mg/dL), and, thus, they were excluded from the corresponding multivariable analyses. Blood pressure was measured twice consecutively using the right upper arm with an automated digital sphygmomanometer based on the oscillometric method using a suitably sized cuff attached to UM‐15P (Parama‐tech Co., Ltd., Fukuoka, Japan) and HEM‐907 (OMRON Co., Ltd., Kyoto, Japan), an automated digital sphygmomanometer based on the oscillometric method.
Alcohol consumption
Alcohol consumption was estimated using a brief self‐administered diet history questionnaire (BDHQ). The BDHQ is a brief version of the diet history questionnaire that asks individuals about the consumption frequency and amount of Japanese sake, beer, wine, whiskey, and brandy, which are commonly consumed in Japan. Estimated alcohol consumption was calculated using an ad hoc computer algorithm, which included weighting factors for the BDHQ. The reproducibility and validity of the BDHQ have already been shown 18 .
The median amount of alcohol consumption among alcohol drinkers was 25 g/day. Alcohol consumption was analyzed in the following groups: non‐drinkers, <1 g/day, light‐to‐moderate drinkers, 1–25 g/day; and intensive drinkers, ≥25 g/day.
Other variables
BMI was calculated as current bodyweight (kg) divided by the square of body height (m). Participants were grouped into two categories: lean/normal‐weight (BMI <24.9) and overweight/obese (BMI of ≥25).
Self‐administered questionnaires were used to assess other variables. The habit of smoking was classified into two groups based on whether participants were current smokers. The frequency of exercise was categorized into two groups according to answers to the following questions: “How often do you exercise per week?”. When they replied ≥30 min every time and ≥5 times/week, they were considered to have a regular exercise habit.
Statistical analysis
All participants were allocated to BMI groups (<25 group and ≥25 group) and alcohol consumption groups (non‐, light‐to‐moderate and intensive drinkers). An analysis of covariance and the Bonferroni post‐hoc test were used to compare the averages of continuous variables among alcohol consumption groups. A simple linear regression analysis of variance (two‐way anova) was used to examine differences in glucose metabolism indices between the BMI groups and alcohol drinker groups. The odds ratio (OR) and 95% confidence interval (CI) for impaired FPG were analyzed according to alcohol consumption and BMI using a multivariate logistic regression analysis. Data were adjusted for age, BMI, family history of diabetes, current smoking, regular exercise, antihypertensive medication use and antihyperlipidemic medication use. All analyses were conducted using IBM SPSS Statistics version 25.0 (IBM Corp., Armonk, NY, USA). The significance of differences was set at P < 0.05 for all analyses.
Results
The prevalence of participants who were non‐, light‐to‐moderate and intensive alcohol drinkers was not significantly different between the BMI <25 and BMI ≥25 groups (Table 1). No significant differences were observed in age, BMI, waist circumference, family history of diabetes, current smoking habit, regular exercise habit or C‐reactive protein among drinking groups at either BMI. In the BMI <25 group, systolic blood pressure, diastolic blood pressure and high‐density lipoprotein cholesterol were higher, whereas low‐density lipoprotein cholesterol was lower in intensive drinkers than in non‐drinkers. In the BMI ≥25 group, triglyceride levels were higher in intensive drinkers than in non‐drinkers.
Table 1.
Characteristics of participants according to body mass index and alcohol consumption in men
| BMI <25 kg/m2 (n = 277) | BMI ≥25 kg/m2 (n = 125) | |||||||
|---|---|---|---|---|---|---|---|---|
| Non‐drinker | Light‐to‐moderate drinker | Intensive drinker | P‐value | Non‐drinker | Light‐to‐moderate drinker | Intensive drinker | P‐value | |
| Participants, n (%) | 63 (22.7) | 109 (39.4) | 105 (37.9) | 35 (28.0) | 47 (37.6) | 43 (34.4) | ||
| Age (years) | 62.9 ± 11.9 | 61.5 ± 10.9 | 59.0 ± 10.6 | NS | 57.3 ± 12.6 | 60.7 ± 12.0 | 60.8 ± 9.7 | NS |
| Family history of diabetes, n (%) | 5 (7.9) | 4 (3.7) | 12 (11.4) | NS | 5 (14.3) | 7 (14.9) | 6 (12.8) | NS |
| BMI (kg/m2) | 22.3 ± 2.0 | 22.4 ± 1.8 | 22.4 ± 1.8 | NS | 27.7 ± 2.6 | 27.3 ± 2.1 | 27.0 ± 1.8 | NS |
| Waist circumference (cm) | 80.5 ± 6.6 | 82.0 ± 6.2 | 82.0 ± 5.4 | NS | 93.7 ± 8.0 | 94.3 ± 6.0 | 93.0 ± 5.7 | NS |
| Current smoking, n (%) | 19 (30.2) | 32 (29.3) | 41 (39.0) | NS | 8 (22.9) | 12 (25.5) | 16 (37.3) | NS |
| Regular exercise (yes) | 13 (20.6) | 25 (22.9) | 24 (22.9) | NS | 8 (22.9) | 13 (27.7) | 10 (23.3) | NS |
| Systolic BP (mmHg) | 134 ± 18 | 141 ± 19* | 140 ± 19* | <0.05 | 144 ± 17 | 143 ± 20 | 145 ± 19 | NS |
| Diastolic BP (mmHg) | 79 ± 12 | 82 ± 12 | 84 ± 11* | NS | 88 ± 11 | 87 ± 10 | 85 ± 14 | NS |
| Triglycerides (mmol/L) | 1.24 ± 0.73 | 1.47 ± 0.97 | 1.31 ± 0.82 | NS | 1.59 ± 0.80 | 1.67 ± 0.68 | 2.13 ± 1.28* | <0.05 |
| Total cholesterol (mmol/L) | 5.43 ± 0.95 | 5.34 ± 0.85 | 5.35 ± 0.79 | NS | 5.49 ± 0.70 | 5.67 ± 0.81 | 5.47 ± 0.84 | NS |
| HDL cholesterol (mmol/L) | 1.53 ± 0.36 | 1.58 ± 0.41 | 1.76 ± 0.41**, †† | <0.001 | 1.32 ± 0.31 | 1.42 ± 0.26 | 1.45 ± 0.39 | NS |
| LDL cholesterol (mmol/L) | 3.28 ± 0.83 | 3.21 ± 0.75 | 2.97 ± 0.75* | <0.05 | 3.52 ± 0.78 | 3.44 ± 0.70 | 3.21 ± 0.83 | NS |
| CRP (mg/dL) | 0.11 ± 0.27 | 0.22 ± 0.96 | 0.09 ± 0.11 | NS | 0.09 ± 0.08 | 0.10 ± 0.08 | 0.12 ± 0.15 | NS |
| Alcohol consumption (g/day) | 0.0 | 12.6 ± 7.9** | 48.4 ± 20.7**, †† | <0.001 | 0.0 | 11.8 ± 6.6** | 48.7 ± 21.0**, †† | <0.001 |
Data are n (%) or mean ± standard deviation. The amount of alcohol consumption in light‐to‐moderate drinkers and intensive drinkers were <25 and ≥25 g/day, respectively. P‐values were calculated by the χ2‐test or analysis of variance (anova) and the Bonferroni post‐hoc test.
BP, blood pressure; CRP, C‐reactive protein; HDL, high‐density lipoprotein; LDL, low‐density lipoprotein; NS, not significant.
P < 0.05.
P < 0.01 versus non‐drinker of same body mass index (BMI) group.
P < 0.05.
P < 0.01 versus light to moderate drinker of same BMI group.
Light‐to‐moderate and intensive drinkers had slightly, but significantly, higher FPG and lower HOMA‐B levels than non‐drinkers in the BMI <25‐group, even after adjustments for age, BMI, a family history of diabetes, current smoking, regular exercise, antihypertensive medication use and antihyperlipidemic medication use (Table 2). However, in the BMI ≥25‐group, higher FPG and lower HOMA‐B levels were observed in intensive drinkers only. Light‐to‐moderate drinkers in the BMI ≥25‐group had lower HbA1c and HOMA‐IR levels than non‐drinkers.
Table 2.
Crude and multivariate‐adjusted mean values of insulin, glucose, homeostasis model assessment of insulin secretion capacity and homeostasis model assessment of insulin resistance according to body mass index and alcohol intake group
| BMI <25 kg/m2 (n = 277) | BMI ≥25 kg/m2 (n = 125) | |||||||
|---|---|---|---|---|---|---|---|---|
| Non‐drinker | Light‐to‐moderate drinker | Intensive drinker | P‐value | Non‐drinker | Light‐to‐moderate drinker | Intensive drinker | P‐value | |
| FPG (mmol/L) | ||||||||
| Crude | 4.98 ± 0.06 | 5.18 ± 0.05** | 5.17 ± 0.05* | <0.05 | 5.17 ± 0.09 | 5.18 ± 0.08 | 5.56 ± 0.08**, †† | <0.005 |
| Adjusted | 4.92 ± 0.07 | 5.20 ± 0.05** | 5.17 ± 0.05** | <0.01 | 5.23 ± 0.09 | 5.16 ± 0.07 | 5.53 ± 0.08*, † | <0.005 |
| HbA1c (%) | ||||||||
| Crude | 5.78 ± 0.04 | 5.70 ± 0.03 | 5.66 ± 0.03 | NS | 5.87 ± 0.06 | 5.74 ± 0.05 | 5.82 ± 0.05 | NS |
| Adjusted | 5.79 ± 0.04 | 5.68 ± 0.04 | 5.67 ± 0.03 | NS | 5.89 ± 0.06 | 5.73 ± 0.05* | 5.81 ± 0.05 | <0.05 |
| Fasting insulin (μU/mL) | ||||||||
| Crude | 4.66 ± 0.35 | 4.57 ± 0.26 | 3.66 ± 0.27*, † | <0.05 | 8.40 ± 0.71 | 6.66 ± 0.62 | 6.80 ± 0.64 | NS |
| Adjusted | 4.61 ± 0.32 | 4.25 ± 0.24 | 4.05 ± 0.25*, † | <0.05 | 8.03 ± 0.69 | 6.71 ± 0.59 | 7.06 ± 0.61 | NS |
| HOMA‐B | ||||||||
| Crude | 63.2 ± 4.3 | 54.5 ± 3.4* | 44.7 ± 3.4**, † | <0.005 | 99.9 ± 7.8 | 82.8 ± 6.8 | 68.5 ± 7.1** | <0.05 |
| Adjusted | 66.0 ± 4.0 | 48.6 ± 3.2* | 43.4 ± 3.2**, † | <0.001 | 91.9 ± 7.3 | 84.0 ± 6.3 | 73.0 ± 6.6 | NS |
| HOMA‐IR | ||||||||
| Crude | 1.02 ± 0.08 | 1.05 ± 0.06 | 0.83 ± 0.06 † | <0.05 | 1.99 ± 0.18 | 1.56 ± 0.16* | 1.71 ± 0.17 | <0.05 |
| Adjusted | 1.03 ± 0.08 | 1.03 ± 0.06 | 0.84 ± 0.07 † | NS | 1.93 ± 0.18 | 1.57 ± 0.15 | 1.75 ± 0.16 | NS |
Data are n (%) or mean ± standard error. The amount of alcohol intake in light to moderate drinker and intensive drinker were <25 and ≥25 g/day, respectively. P‐values are calculated by analysis of variance (anova) and the Bonferroni post‐hoc test. Values were adjusted for age, body mass index (BMI), family history of diabetes, current smoking, regular exercise, antihypertensive medication use and antihyperlipidemic medication use.
FPG, fasting plasma glucose; HbA1c, glycated hemoglobin; HOMA‐B, homeostasis model assessment of insulin secretion capacity; HOMA‐IR, homeostasis model assessment of insulin resistance; NS, not significant.
P < 0.05.
P < 0.01 versus non‐drinker of same BMI group.
P < 0.05.
P < 0.01 versus moderate drinker of same BMI group.
A multivariable logistic regression analysis was carried out to calculate the OR and 95% CI of impaired FPG, HbA1c, low insulin secretion capacity and insulin resistance according to alcohol consumption (Table 3). Using non‐drinkers as a reference, light‐to‐moderate and intensive alcohol consumption was positively associated with impaired FPG (≥5.6 mmol/L) and an abnormally low level of HOMA‐B (<40) in the BMI <25‐group, even after adjustments for confounders. However, no relationships were observed between light‐to‐moderate alcohol consumption and impaired FPG and HOMA‐B levels in the BMI ≥25 group. Light‐to‐moderate alcohol consumption was negatively associated with HbA1c in the BMI ≥25‐group. Significant interactions were observed between BMI and alcohol consumption in terms of FPG, HOMA‐B and HbA1c levels. Therefore, BMI appears to play an essential role in the relationship between alcohol consumption and glucose and insulin metabolism.
Table 3.
Odds ratios of alcohol drinkers to predict the risk of impaired fasting plasma glucose (≥5.6 mmol/L), glycated hemoglobin (>6.0%), homeostasis model assessment of insulin secretion capacity (<40) and homeostasis model assessment of insulin resistance (≥1.6) in both body mass index groups
| BMI <25 kg/m2 (n = 277) | BMI ≥25 kg/m2 (n = 125) | P‐value for interaction between BMI and alcohol groups | |||||
|---|---|---|---|---|---|---|---|
| Non‐drinker | Light‐to‐moderate drinker | Intensive drinker | Non‐drinker | Light‐to‐moderate drinker | Intensive drinker | ||
| FPG ≥5.6 mmol/L | |||||||
| Model 1 | 1 | 2.545 (1.007–6.428)* | 3.132 (1.240–7.911)* | 1 | 0.721 (0.230–2.257) | 2.183 (0.746–6.338) | 0.005 |
| Model 2 | 1 | 2.598 (1.019–6.622)* | 2.907 (1.138–7.426)* | 1 | 0.501 (0.144–1.747) | 1.223 (0.368–4.063) | 0.009 |
| HbA1c ≥6.0% | |||||||
| Model 1 | 1 | 0.470 (0.197–1.121) | 0.557 (0.237–1.307) | 1 | 0.116 (0.029–0.472)** | 0.725 (0.274–1.916) | 0.007 |
| Model 2 | 1 | 0.406 (0.155–1.100) | 0.572 (0.243–1.505) | 1 | 0.109 (0.019–0.630)** | 1.024 (0.271–3.870) | 0.048 |
| HOMA‐B <40 | |||||||
| Model 1 | 1 | 2.318 (1.002–5.332)* | 2.944 (1.229–6.688)* | 1 | 4.023 (0.431–37.54) | 9.967 (1.135–87.52)* | 0.013 |
| Model 2 | 1 | 2.345 (1.006–5.521)* | 2.712 (1.016–6.397)* | 1 | 4.314 (0.412–45.18) | 7.538 (0.752–75.54) | 0.024 |
| HOMA‐IR ≥1.6 | |||||||
| Model 1 | 1 | 1.443 (0.488–4.268) | 0.521 (0.150–1.805) | 1 | 0.408 (0.227–1.828) | 0.998 (0.357–2.789) | 0.24 |
| Model 2 | 1 | 1.338 (0.449–3.990) | 0.517 (0.149–1.799) | 1 | 0.526 (0.172–1.608) | 0.836 (0.267–2.615) | 0.86 |
The amount of alcohol consumption in light to moderate drinker and intensive drinker were <25 and ≥25 g/day, respectively. Model 1: adjusted for age and body mass index (BMI); model 2: adjusted for age, BMI, family history of diabetes, current smoking, regular exercise, antihypertensive medication use and antihyperlipidemic medication use.
FPG, fasting plasma glucose; HbA1c, glycated hemoglobin; HOMA‐B, homeostasis model assessment of insulin secretion capacity; HOMA‐IR, homeostasis model assessment of insulin resistance.
P < 0.05.
P < 0.01.
We investigated the impact of alcohol consumption on the relationship between FPG and insulin secretion in each BMI group (Table 4). Among non‐drinkers in both BMI groups, fasting insulin levels were markedly higher in participants with impaired FPG than in those with normal FPG, resulting in no significant difference in HOMA‐B levels between participants with impaired FPG and normal FPG. During the early stage of impaired glucose tolerance, increased insulin secretion might be a compensatory response to maintain FPG levels within the non‐diabetic range. However, among alcohol drinkers in the BMI <25‐group, fasting insulin was similar between participants with and without impaired FPG, resulting in HOMA‐B being significantly lower in participants with impaired FPG. These results suggest that alcohol consumption, including light‐to‐moderate consumption, suppresses compensatory insulin secretion accompanying increasing FPG in the BMI <25‐group.
Table 4.
Comparison of homeostasis model assessment of insulin secretion capacity and homeostasis model assessment of insulin resistance among alcohol consumption groups in participants with impaired fasting plasma glucose (5.6–6.9 mmol/L)
| BMI <25 kg/m2 (n = 277) | BMI ≥25 kg/m2 (n = 125) | |||||||
|---|---|---|---|---|---|---|---|---|
| Non‐Drinker | Light‐to‐Moderate drinker | Intensive drinker | P‐value | Non‐drinker | Light‐to‐Moderate drinker | Intensive drinker | P‐value | |
| No. participants | ||||||||
| FPG <5.6 mmol/L | 56 | 83 | 77 | 26 | 36 | 24 | ||
| FPG ≥5.6 mmol/L | 7 | 26 | 28 | 9 | 11 | 19 | ||
| Fasting insulin level | ||||||||
| FPG <5.6 mmol/L | 4.34 ± 2.28 | 4.46 ± 3.08 | 3.34 ± 1.81* | <0.05 | 7.46 ± 3.40 | 6.51 ± 3.84 | 6.08 ± 2.83 | 0.39 |
| FPG ≥5.6 mmol/L | 7.11 ± 5.50 | 4.93 ± 3.04 | 4.56 ± 2.95 | 0.21 | 11.12 ± 7.38 | 7.14 ± 3.42 | 7.70 ± 4.60 | 0.18 |
| HOMA‐B | ||||||||
| FPG <5.6 mmol/L | 63.3 ± 39.0 | 58.9 ± 40.5 | 47.8 ± 23.8* | <0.05 | 101.5 ± 55.4 | 80.2 ± 55.9 | 75.7 ± 34.5 | 0.18 |
| FPG ≥5.6 mmol/L | 62.3 ± 43.3 | 40.9 ± 25.1*,† | 36.1 ± 17.4*,† | <0.05 | 91.6 ± 63.0 | 59.0 ± 29.1 | 59.8 ± 34.7 | 0.14 |
| HOMA‐IR | ||||||||
| FPG <5.6 mmol/L | 0.91 ± 0.46 | 0.97 ± 0.68 | 0.74 ± 0.43 | 0.068 | 1.66 ± 0.93 | 1.45 ± 0.88 | 1.40 ± 0.69 | 0.50 |
| FPG ≥5.6 mmol/L | 1.83 ± 1.48 | 1.27 ± 0.82 | 1.08 ± 0.59 † | 0.12 | 2.94 ± 1.93 | 1.89 ± 0.96 | 2.09 ± 1.28 | 0.21 |
Data are mean ± standard deviation. The amount of alcohol consumption in light‐to‐moderate drinkers and intensive drinkers were <25 and ≥25 g/day, respectively. P‐values were calculated by analysis of variance (anova) and the Bonferroni post‐hoc test.
FPG, fasting plasma glucose; HOMA‐B, homeostasis model assessment of insulin secretion capacity; HOMA‐IR, homeostasis model assessment of insulin resistance.
P < 0.05 versus non‐drinker of same fasting plasma glucose (FPG) group.
P < 0.05 versus FPG <100 mg/day of same alcohol group in each body mass index (BMI).
Discussion
In the present study, alcohol consumption correlated with a low HOMA‐B level regardless of BMI. In the BMI <25‐group, even light‐to‐moderate alcohol consumption was significantly associated with an abnormally low level of HOMA‐B and impaired FPG. Increases in basal insulin secretion by elevated FPG, a compensatory response to maintain normal FPG, is common in impaired FPG. However, alcohol consumption appeared to suppress compensatory insulin secretion in participants with impaired FPG. In contrast, light‐to‐moderate alcohol consumption was associated with low levels of HbA1c and HOMA‐IR, but not HOMA‐B or FPG in the BMI ≥25 group.
A low insulin secretion capacity is common and has been implicated in the high prevalence of non‐obese diabetes in East Asians 14 , 15 . Epidemiological studies and meta‐analyses of interventional studies reported that alcohol consumption is associated with low levels of insulin secretion and B‐cell dysfunction 6 , 7 , 8 . Furthermore, in an animal study, chronic ethanol exposure was associated with significant apoptotic B‐cell death and reductions in insulin secretion as a result of the induction of pancreatic inflammation and oxidative stress 9 , 10 . The present results are consistent with these findings. Alcohol consumption was associated with reductions in HOMA‐B levels regardless of BMI, and, thus, the HOMA‐B levels of alcohol drinkers were very low in normal‐weight men who might naturally have a low insulin secretion capacity.
Waki et al. 12 previously carried out a cohort study of 12,913 Japanese men for 10 years, and concluded that moderate alcohol intake was positively associated with the incidence of type 2 diabetes mellitus in lean/normal‐weight men (BMI ≤22 kg/m2). A recent study carried out in Korea showed that alcohol consumption elevated FPG and the risk of type 2 diabetes mellitus by further reducing HOMA‐B levels in participants with a high genetic risk score for an impaired insulin secretory capacity 8 . In the present study, alcohol consumption was associated with abnormally low HOMA‐B levels and impaired FPG in the BMI <25 group. Therefore, alcohol‐induced insulin reductions might be more severe in lean/normal‐weight individuals than in obese individuals because of their naturally low insulin secretion capacity.
Epidemiological studies in East Asian countries reported that alcohol consumption was associated with an increase in FPG in the non‐diabetes population 6 , 19 ; however, alcohol consumption did not increase FPG in white people 20 . The mechanisms responsible for increases in FPG by alcohol consumption in East Asians have not yet been elucidated. However, several mechanisms might explain alcohol‐associated increases in FPG. In the fasting state, insulin suppresses hepatic gluconeogenesis and FPG by its direct effects on the liver, and by suppressing glucagon secretion 21 , 22 . Therefore, the reduced basal secretion of insulin might be causal for impaired FPG in alcohol drinkers. Furthermore, a solution of starch with alcohol has been shown to produce higher postprandial plasma glucose levels than the same solution without alcohol 23 . In Japan and other East Asian countries, the consumption of staple food, namely, a carbohydrate, such as rice or noodles, after drinking alcohol is one of the popular eating habits of adults, and might contribute to the impact of alcohol on glucose metabolism. Additionally, genetic factors might cause higher FPG in Asian alcohol drinkers. Aldehyde dehydrogenase variants have been reported as a polymorphism that is mainly observed in East Asian populations and associated with alcohol‐related diseases or risk factors in a number of Asian population studies 24 , 25 . A study of 1,819 Japanese individuals without diabetes showed that FPG was positively associated with alcohol consumption in men with the ALDH2 504 Lys allele, but not in those with the ALDH2 504 Glu/Glu genotype 26 . These mechanisms might be involved in the alcohol‐associated increases in FPG observed in East Asians.
In contrast to elevated FPG in the BMI <25 group, light‐to‐moderate alcohol consumption was associated with lower HbA1c and lower HOMA‐IR in the BMI ≥25 group (Table 2). Previous studies reported that moderate alcohol consumption is a risk reduction factor for type 2 diabetes mellitus due to the beneficial effects of alcohol on insulin resistance 27 , 28 . Adipokines and inflammation factors play key roles in the development of insulin resistance 29 . Excess adipose tissue, particularly visceral fat, produces high levels of adipokines, which promote insulin resistance, whereas the expression of factors that prevent insulin resistance, such as adiponectin, is decreased 30 . A previous study showed that adiponectin messenger ribonucleic acid levels in obese mice were approximately 2.9‐fold higher in the alcohol‐consuming group than in the water‐consuming group, but were 1.8‐fold higher in non‐obese mice 31 . The decreases induced in insulin resistance and HbA1c by alcohol consumption might be associated with a marked increase in systemic adiponectin levels in obese individuals.
There were some limitations to the present study that need to be addressed. Due to the cross‐sectional nature of this study, causal inference cannot be reached. Furthermore, the number of participants was not sufficiently large to elucidate any relationships. Additionally, we did not obtain results for women because of the small number of alcohol drinkers among women in Shika town; women accounted for 28.8% of alcohol drinkers and men 75.7%. As we categorized participants into three alcohol consumption groups based on a self‐reported questionnaire, we cannot deny the misclassification of actual drinking patterns.
Alcohol consumption, even a small amount, might contribute to reductions in the fasting insulin secretion capacity and impaired FPG in lean/normal‐weight non‐diabetic Japanese men. Body size appears to play an essential role in the relationship between light‐to‐moderate alcohol consumption and fasting glucose and insulin metabolism. Further studies are required to clarify whether the reductions induced in HOMA‐B and impaired FPG by light‐to‐moderate alcohol consumption lead to the development of type 2 diabetes mellitus in lean/normal‐weight East Asians.
Disclosure
The authors declare no conflict of interest.
Acknowledgments
We thank all of the staff of the Health and Welfare Center of Shika town, and all of our colleagues at the Department of Environmental and Preventive Medicine, Graduate School of Medical Sciences, Kanazawa University.
J Diabetes Investig 2021; 12: 869–876
References
- 1. Manthey J, Shield KD, Rylett M, et al. Global alcohol exposure between 1990 and 2017 and forecasts until 2030: a modelling study. Lancet 2019; 22: 2493–2502. [DOI] [PubMed] [Google Scholar]
- 2. Baliunas DO, Taylor BJ, Irving H, et al. Alcohol as a risk factor for type 2 diabetes: a systematic review and meta‐analysis. Diabetes Care 2009; 32: 2123–2132. [DOI] [PMC free article] [PubMed] [Google Scholar]
- 3. Huang J, Wang X, Zhang Y. Specific types of alcoholic beverage consumption and risk of type 2 diabetes: a systematic review and meta‐analysis. J Diabetes Investig 2017; 8: 56–68. [DOI] [PMC free article] [PubMed] [Google Scholar]
- 4. Crandall JP, Polsky S, Howard AA, et al. Alcohol consumption and diabetes risk in the diabetes prevention program. Am J Clin Nutr 2009; 90: 595–601. [DOI] [PMC free article] [PubMed] [Google Scholar]
- 5. Hulthe J, Fagerberg B. Alcohol consumption and insulin sensitivity: a review. Metab Syndr Relat Disord 2005; 3: 45–50. [DOI] [PubMed] [Google Scholar]
- 6. Tatsumi Y, Morimoto A, Asayama K, et al. Association between alcohol consumption and incidence of impaired insulin secretion and insulin resistance in Japanese: the Saku study. Diabetes Res Clin Pract 2018; 135: 11–17. [DOI] [PubMed] [Google Scholar]
- 7. Schrieks IC, Heil AL, Hendriks HF, et al. The effect of alcohol consumption on insulin sensitivity and glycemic status: a systematic review and meta‐analysis of intervention studies. Diabetes Care 2015; 38: 723–732. [DOI] [PubMed] [Google Scholar]
- 8. Park S, Liu M, Kang S. Alcohol intake interacts with CDKAL1, HHEX, and OAS3 genetic variants, associated with the risk of type 2 diabetes by lowering insulin secretion in korean adults. Alcohol Clin Exp Res 2018; 42: 2326–2336. [DOI] [PubMed] [Google Scholar]
- 9. Tiengo A, Valerio A, Molinari M, et al. Effect of ethanol, acetaldehyde, and acetate on insulin and glucagon secretion in the perfused rat pancreas. Diabetes 1981; 30: 705–709. [DOI] [PubMed] [Google Scholar]
- 10. Ren Z, Yang F, Wang X, et al. Chronic plus binge ethanol exposure causes more severe pancreatic injury and inflammation. Toxicol Appl Pharmacol 2016; 308: 11–19. [DOI] [PMC free article] [PubMed] [Google Scholar]
- 11. Tsumura K, Hayashi T, Suematsu C, et al. Daily alcohol consumption and the risk of type 2 diabetes in Japanese men: the Osaka Health Survey. Diabetes Care 1999; 22: 1432–1437. [DOI] [PubMed] [Google Scholar]
- 12. Waki K, Noda M, Sasaki S, et al. Alcohol consumption and other risk factors for self‐reported diabetes among middle‐aged Japanese: a population‐based prospective study in the JPHC study cohort 1. Diabet Med 2005; 22: 323–331. [DOI] [PubMed] [Google Scholar]
- 13. Seike N, Noda M, Kadowaki T. Alcohol consumption and risk of type 2 diabetes mellitus in Japanese: a systematic review. Asia Pac J Clin Nutr 2008; 17: 545–551. [PubMed] [Google Scholar]
- 14. Yoon KH, Lee JH, Kim JW, et al. Epidemic obesity and type 2 diabetes in Asia. Lancet 2006; 368: 1681–1688. [DOI] [PubMed] [Google Scholar]
- 15. Onishi Y, Hayashi T, Sato KK, et al. Fasting tests of insulin secretion and sensitivity predict future prediabetes in Japanese with normal glucose tolerance. J Diabetes Investig 2010; 1: 191–195. [DOI] [PMC free article] [PubMed] [Google Scholar]
- 16. Boffetta P, McLerran D, Chen Y, et al. Body mass index and diabetes in Asia: a cross‐sectional pooled analysis of 900,000 individuals in the Asia cohort consortium. PLoS One 2011; 6: e19930. [DOI] [PMC free article] [PubMed] [Google Scholar]
- 17. Matthews DR, Hosker JP, Rudenski AS, et al. Homeostasis model assessment: insulin resistance and β‐cell function from fasting plasma glucose and insulin concentrations in man. Diabetologia 1985; 28: 412–419. [DOI] [PubMed] [Google Scholar]
- 18. Kobayashi S, Honda S, Murakami K, et al. Both comprehensive and brief self‐administered diet history questionnaires satisfactorily rank nutrient intakes in Japanese adults. J Epidemiol 2012; 22: 151–159. [DOI] [PMC free article] [PubMed] [Google Scholar]
- 19. Inada S, Koga M. Alcohol consumption reduces HbA1c and glycated albumin concentrations but not 1,5‐anhydroglucitol. Ann Clin Biochem 2017; 54: 631–635. [DOI] [PubMed] [Google Scholar]
- 20. Bonnet F, Disse E, Laville M, et al. Moderate alcohol consumption is associated with improved insulin sensitivity, reduced basal insulin secretion rate and lower fasting glucagon concentration in healthy women. Diabetologia 2012; 55: 3228–3237. [DOI] [PubMed] [Google Scholar]
- 21. Unger RH. Glucagon physiology and pathophysiology in the light of new advances. Diabetologia 1985; 28: 574–578. [DOI] [PubMed] [Google Scholar]
- 22. Puigserver P, Rhee J, Donovan J, et al. Insulin‐regulated hepatic gluconeogenesis through FOXO1‐PGC‐1 alpha interaction. Nature 2003; 423: 550–555. [DOI] [PubMed] [Google Scholar]
- 23. Hatonen KA, Virtamo J, Eriksson JG, et al. Modifying effects of alcohol on the postprandial glucose and insulin. Am J Clin Nutr 2012; 13: 44–49. [DOI] [PubMed] [Google Scholar]
- 24. Cho Y, Shin SY, Won S, et al. Alcohol intake and cardiovascular risk factors: a Mendelian randomisation study. Sci Rep 2015; 5: 1–12. [DOI] [PMC free article] [PubMed] [Google Scholar]
- 25. Okamoto K, Murawaki Y, Yuasa I, et al. Effect of ALDH2 and CYP2E1 gene polymorphisms on drinking behavior and alcoholic liver disease in Japanese male workers. Alcohol Clin Exp Res 2001; 25: 19S–23S. [DOI] [PubMed] [Google Scholar]
- 26. Yin G, Naito M, Wakai K, et al. ALDH2 polymorphism is associated with fasting blood glucose through alcohol consumption in Japanese men. Nagoya J Med Sci 2016; 78: 1–3. [PMC free article] [PubMed] [Google Scholar]
- 27. Koppes L, Dekker J, Hendriks H, et al. Moderate alcohol consumption lowers the risk of type 2 diabetes. A meta‐analysis of prospective observational studies. Diabetes Care 2005; 28: 719–725. [DOI] [PubMed] [Google Scholar]
- 28. Hong J, Smith RR, Harvey AE, et al. Alcohol consumption promotes insulin sensitivity without affecting body fat levels. Int J Obes 2009; 33: 197–203. [DOI] [PubMed] [Google Scholar]
- 29. Calabrò P, Limongelli G, Pacileo G, et al. The role of adiposity as a determinant of an inflammatory milieu. J Cardiovasc Med (Hagerstown) 2008; 9: 450–460. [DOI] [PubMed] [Google Scholar]
- 30. Sierksma A, Patel H, Ouchi N, et al. Effect of moderate alcohol consumption on adiponectin, tumor necrosis factor‐alpha, and insulin sensitivity. Diabetes Care 2004; 27: 184–189. [DOI] [PubMed] [Google Scholar]
- 31. Paulson QX, Hong J, Holcomb VB, et al. Effects of body weight and alcohol consumption on insulin sensitivity. Nutr J 2010; 9: 1–14. [DOI] [PMC free article] [PubMed] [Google Scholar]