Figure 3.

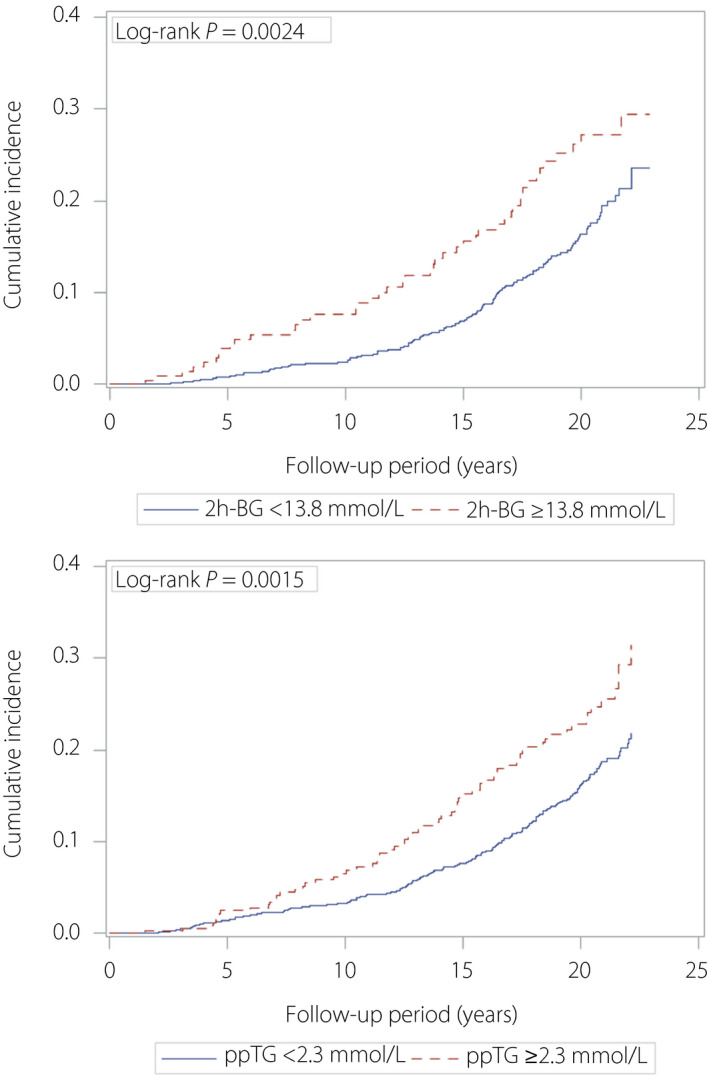
Kaplan–Meier curves in patients stratified using the estimated thresholds for 2‐h post‐breakfast blood glucose (2h‐BG) and postprandial serum triglyceride (ppTG) levels.

Kaplan–Meier curves in patients stratified using the estimated thresholds for 2‐h post‐breakfast blood glucose (2h‐BG) and postprandial serum triglyceride (ppTG) levels.