Figure 2.

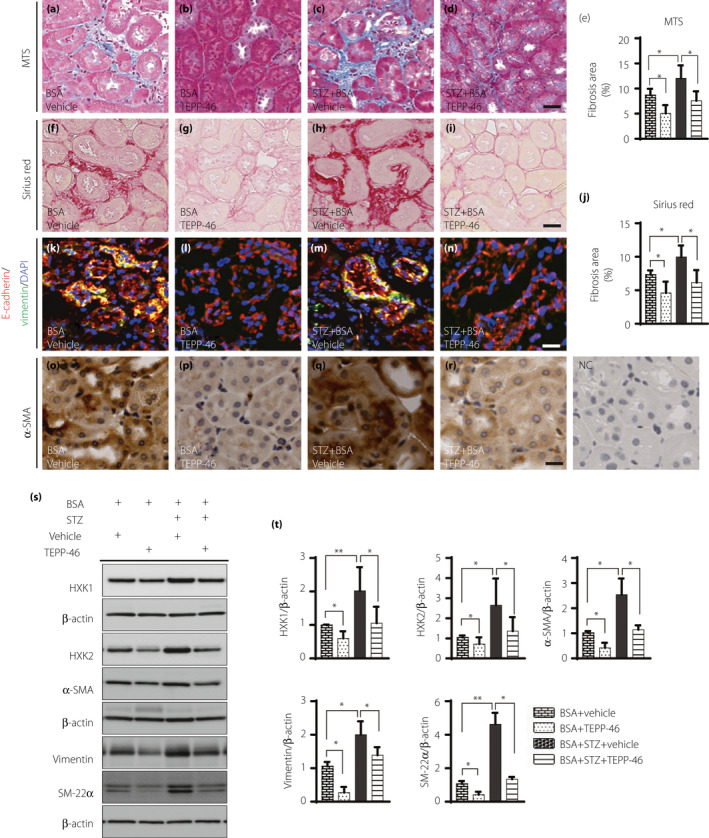
TEPP‐46 suppressed kidney fibrosis associated with EMT program induced by BSA in nondiabetic and diabetic mice. Histology analysis of fibrosis in the kidney samples by (a–d) MTS staining and (f–i) Sirius Red staining, scale bar 25 µm. (e, j) using Image J software to analyze the fibrosis area. BSA, n = 5 mice; BSA + TEPP‐46, n = 6 mice; STZ + BSA, n = 7 mice; STZ + BSA+TEPP‐46, n = 7 mice. (k–n) EMT program was analyzed, E‐cadherin+(epithelial marker)/vimentin+ (mesenchymal marker) cells were recognized as EMT activation. n = 5mice/group. Scale bar: 50 µm. (o–r) Mesenchymal marker α‐SMA expression was analyzed by IHC staining in kidney samples. (s) Representative images of mesenchymal markers vimentin, SM‐22α, and α‐SAM, and glycolysis markers HXK1 and HXK2. (t) Protein levels were calculated by being normalized to β‐actin when densitometric analysis was done. BSA, n = 5 mice; BSA + TEPP‐46, n = 5 mice; STZ + BSA, n = 6 mice; STZ + BSA+TEPP‐46, n = 6 mice. Unpaired two‐tailed t‐test. The data are expressed as the mean ± SEM in the graph. P < 0.05 was recognized as significant. *P < 0.05, **P < 0.01.
