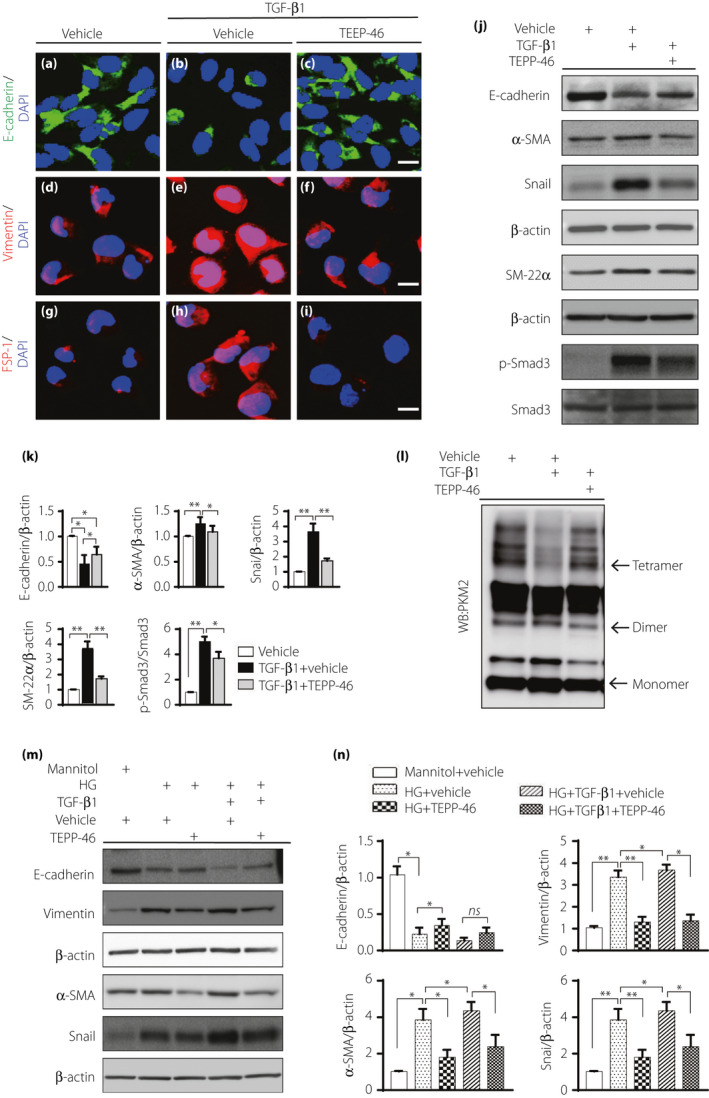
Figure 5.

TEPP‐46 suppressed EMT program induced by high glucose with or without TGF‐β1 in HK2 cells. HK2 cell was exposed to 10 ng/mL TGF‐β1 with or without TEPP‐46 (10 μM) for 48 hours. (a–i) Immunofluoresence images to display EMT program in HK2 cell, E‐cadherin is the epithelia marker, vimentin and FSP1 are mesenchymal markers. (j) Representative western blot images analysis of EMT markers. (k) Protein levels were calculated by normalized to β‐actin when densitometric analysis was done, n = 9 independent experiments. (l) Representative images of cross‐linking analysis of HK2 cell. (m) HK2 cell incubated in high glucose medium (30 mM) with or without TEPP‐46 in the presence of TGF‐β1 or not for 48 h, western blot images of EMT. (n) Protein levels were calculated by normalized to β‐actin when densitometric analysis was done, n = 6 independent experiments. The data are expressed as the mean ± SEM in the graph. P < 0.05 was recognized as significant. *P < 0.05, **P < 0.01. HG: high glucose.
