
Figure 5: Stability of the A1A2 complex along room temperature simulations.
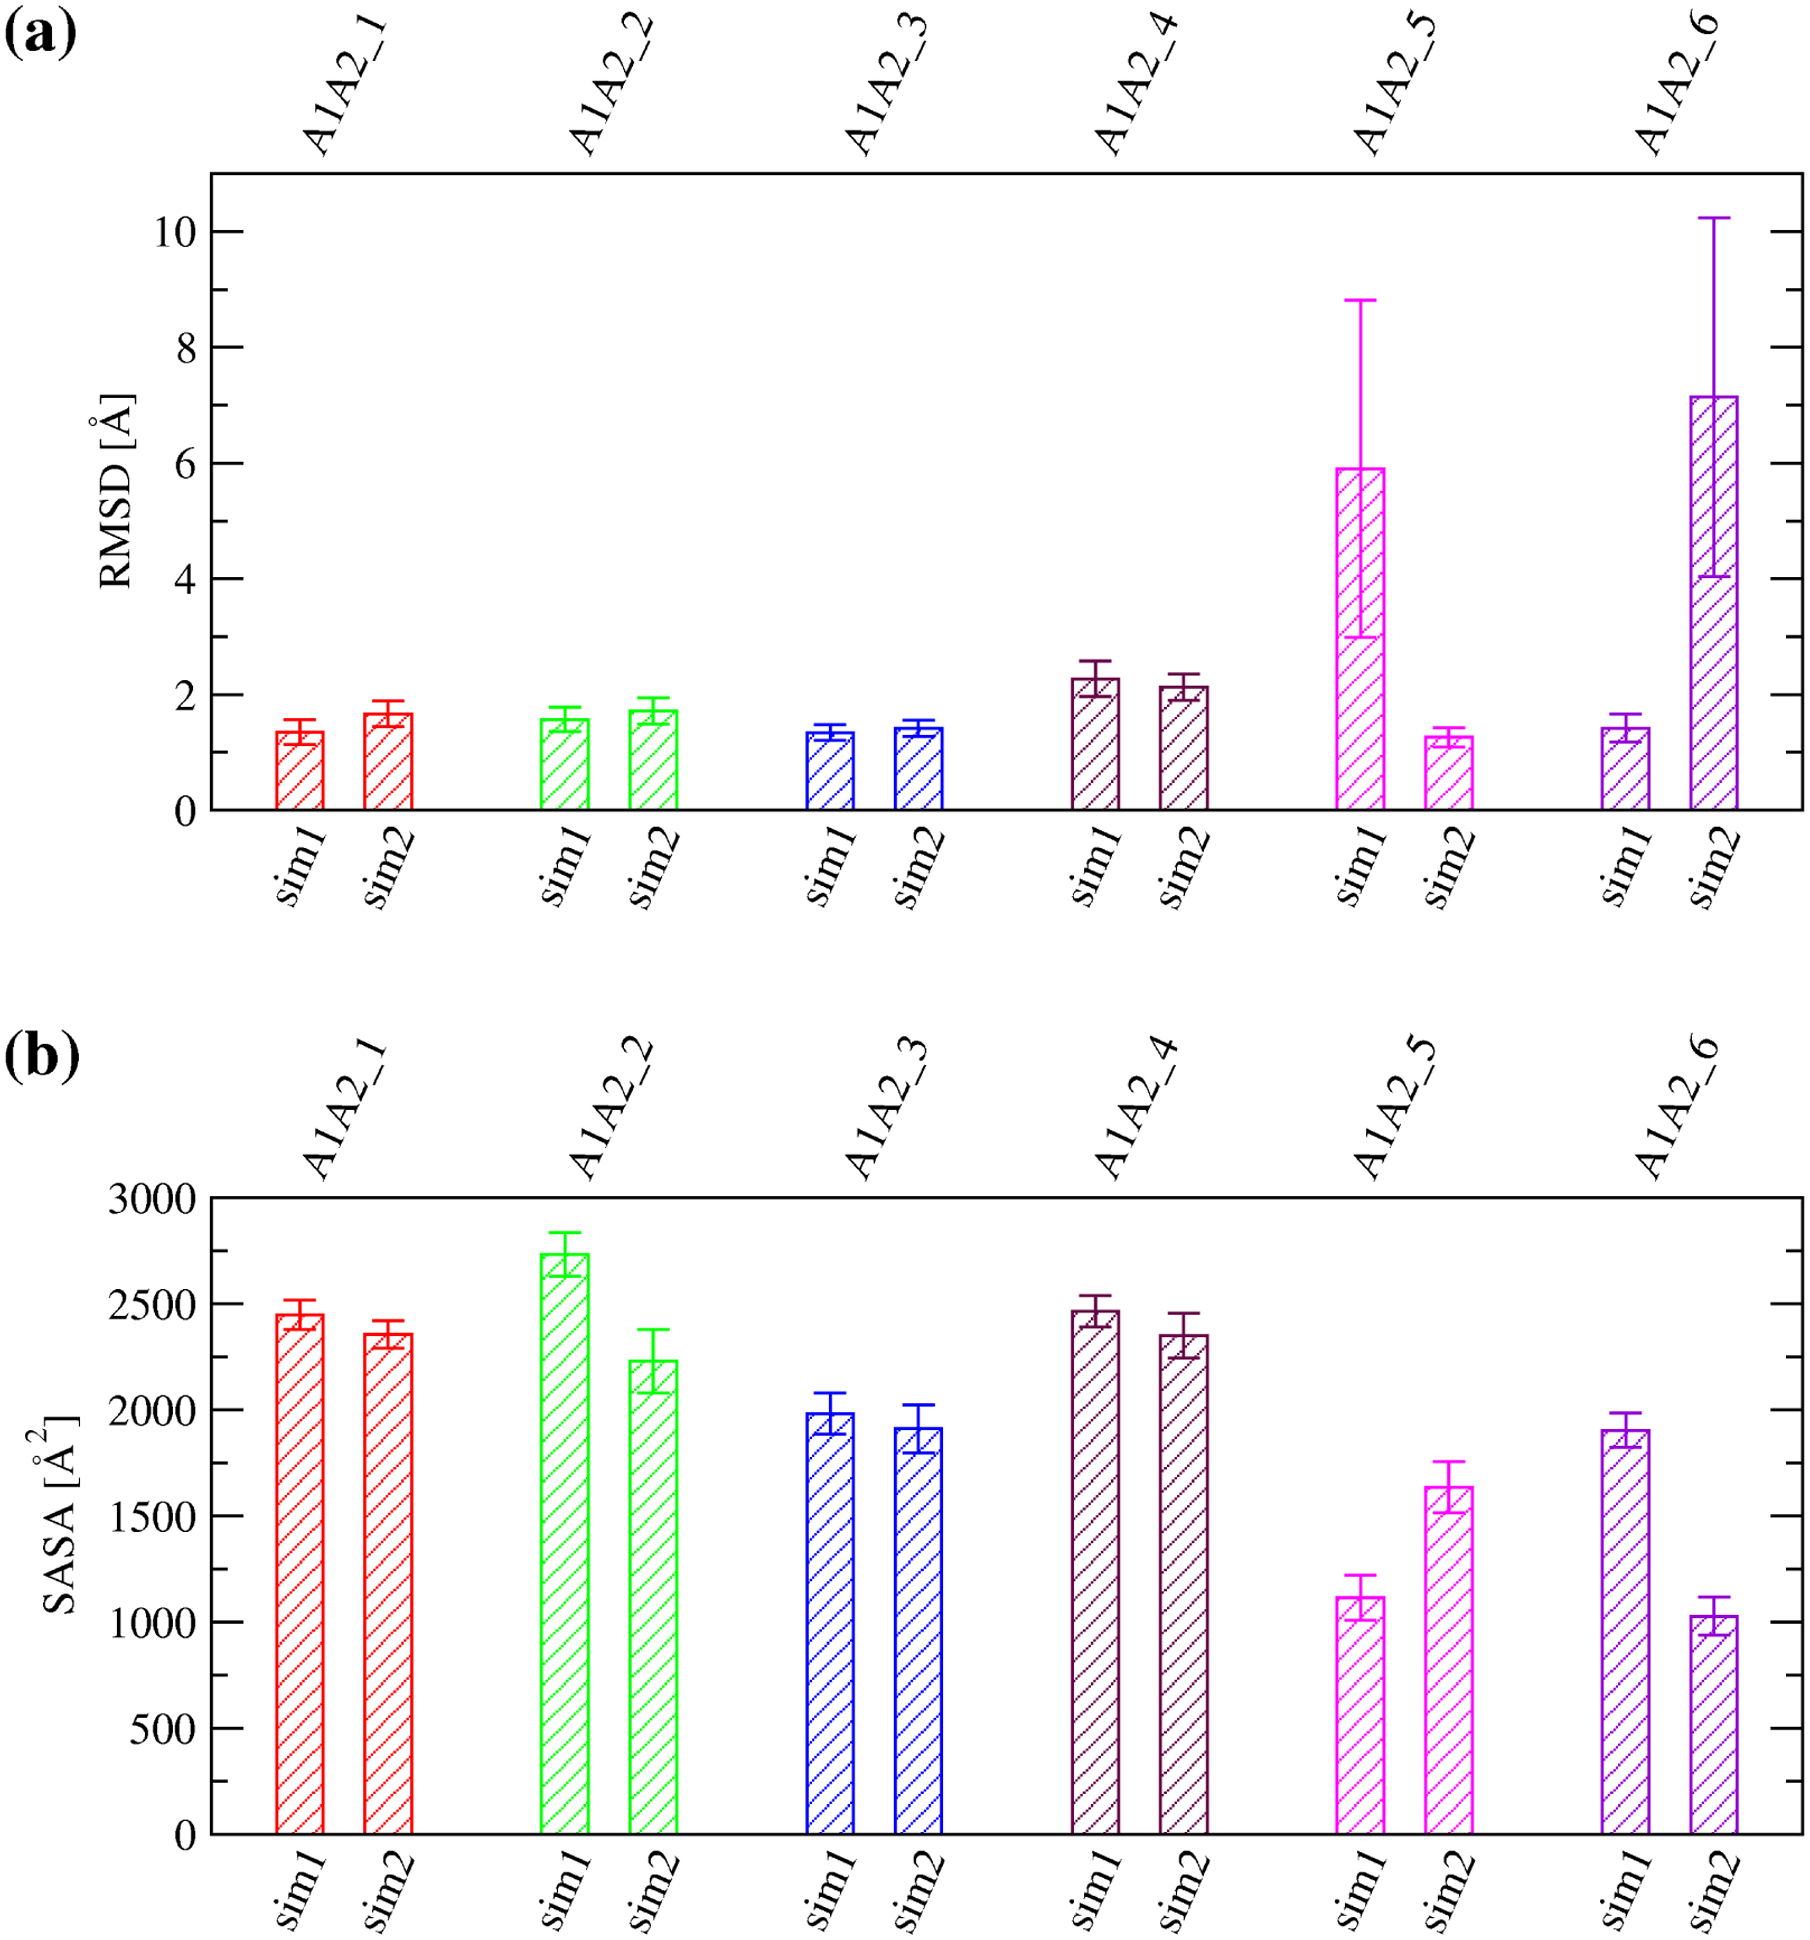
(a) Averages and standard deviations of the Cα RMSD from the initial conformation calculated over the last 40 ns of in total 50-ns long simulations performed at 300 K with the A1A2 complex models. (b) Averages and standard deviations of the SASA buried at the inter-domain interface between A1 and A2 calculated over the last 10 ns of in total 50-ns long simulations with the complex models. The labels “sim1” and “sim2” refer to the two independent simulations run for each A1A2 complex model.