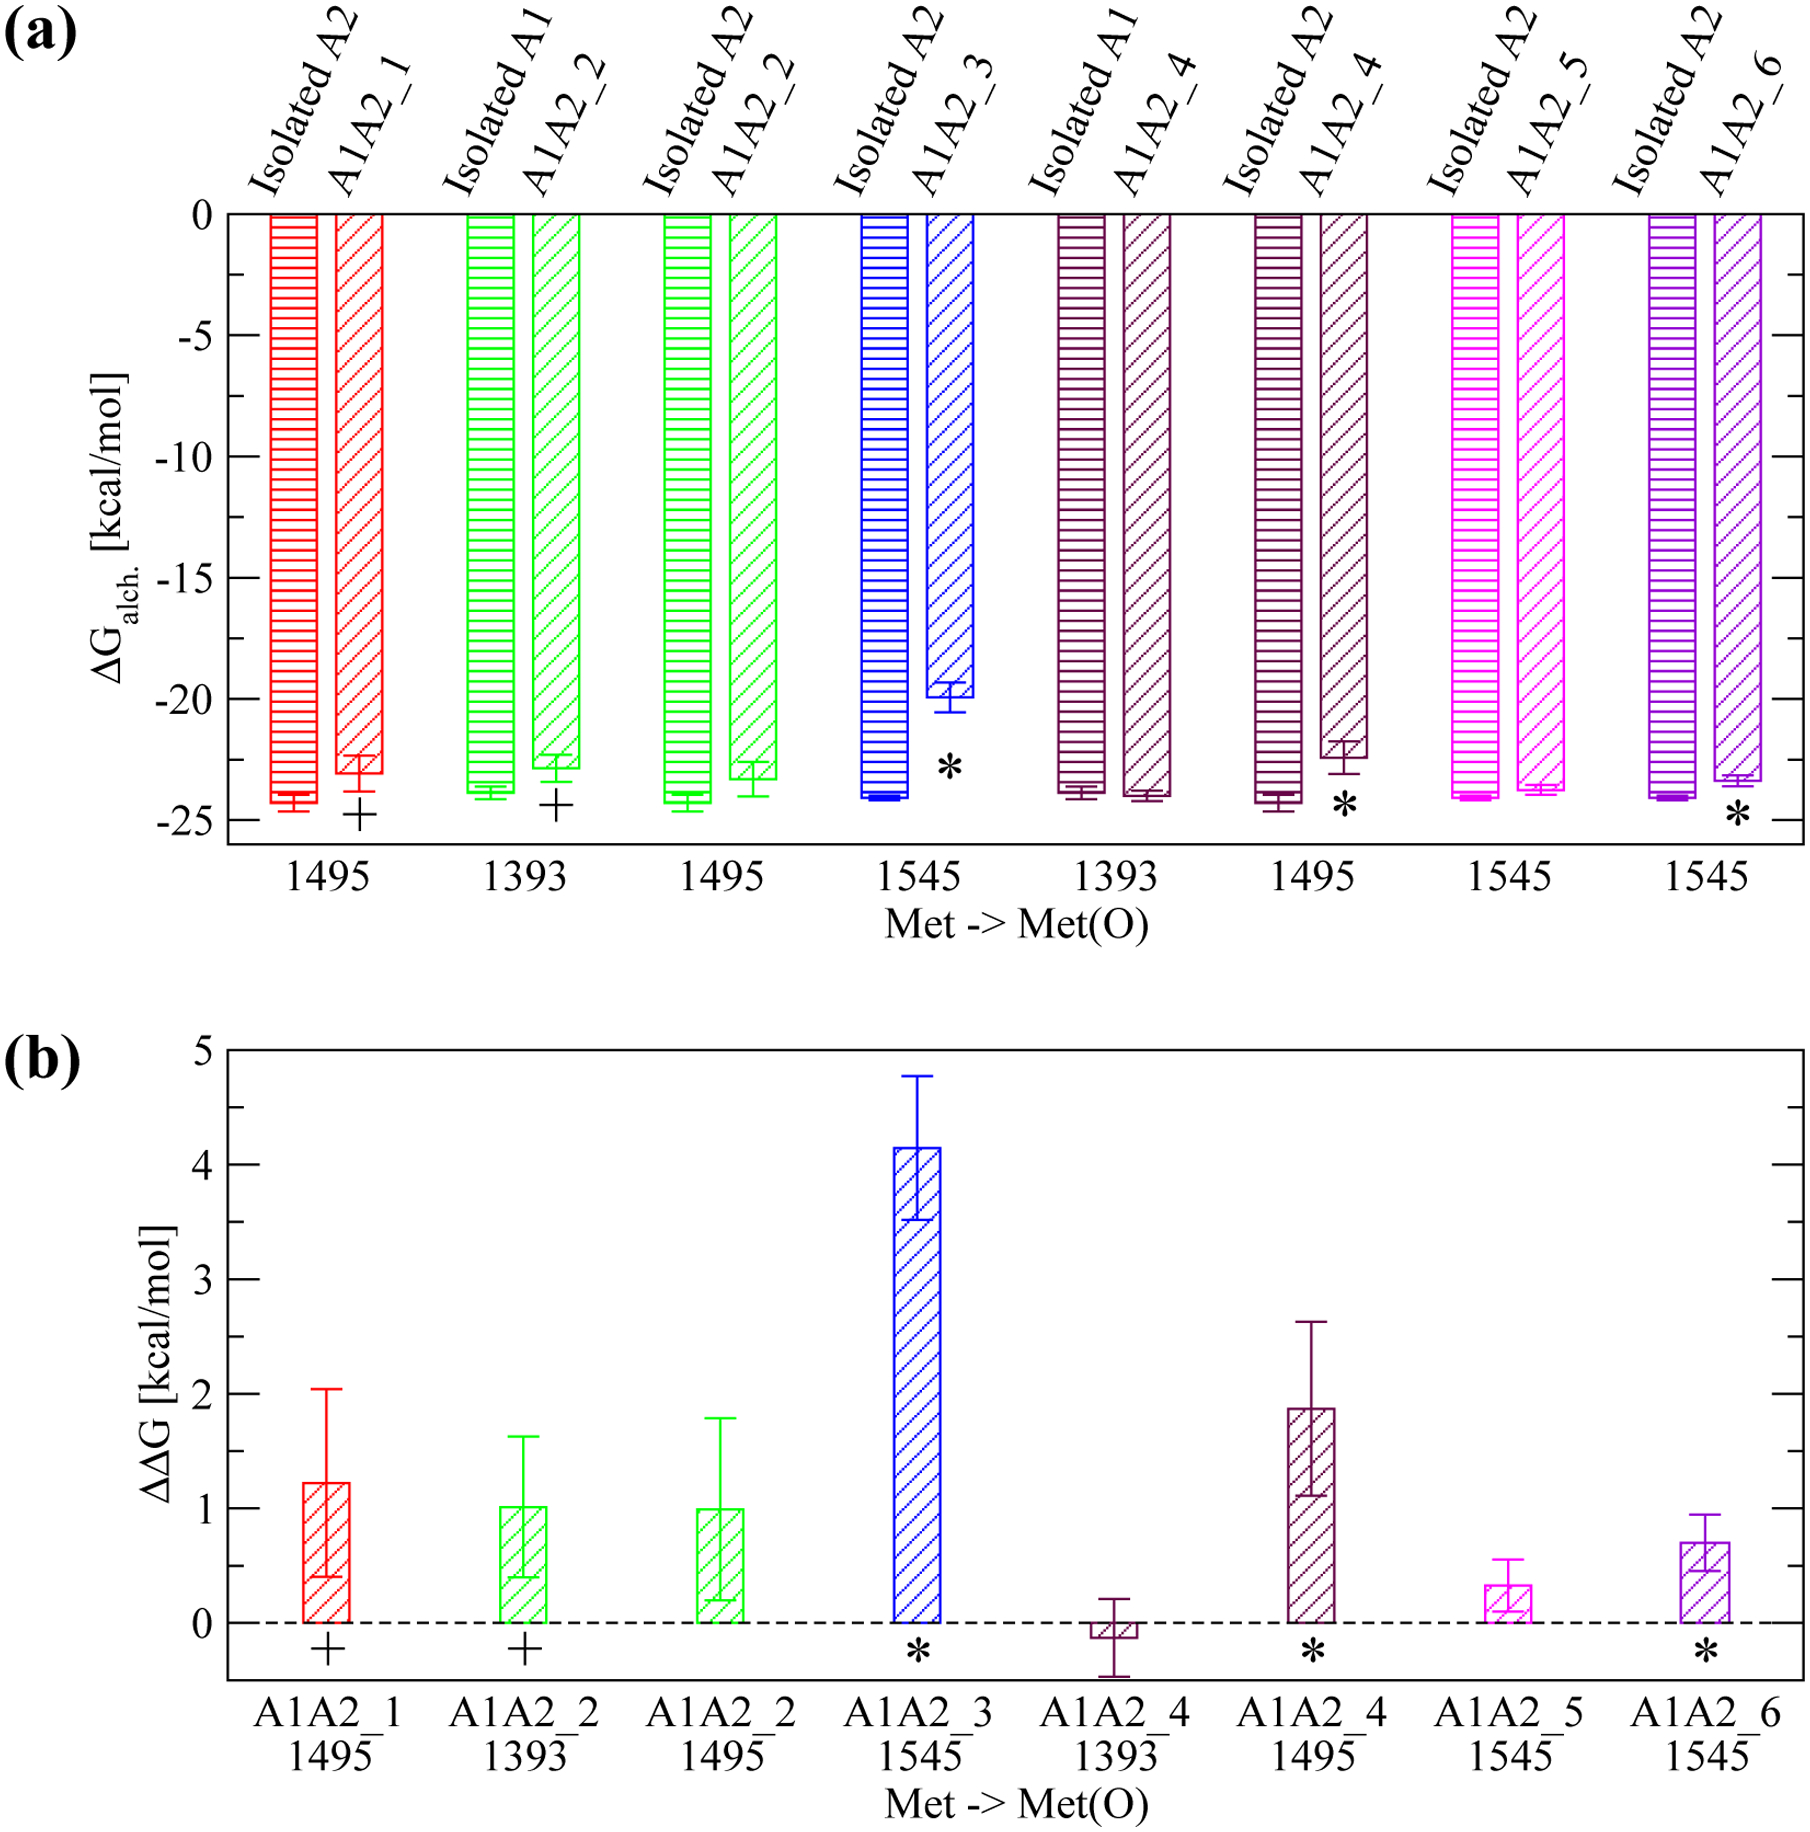
Figure 6: Estimate for the change in free energy of binding upon methionine oxidation.

(a) Calculated ΔGalch.1,2 for the transformation of a given methionine residue to methionine sulfoxide using FEP (see Figure 2 for details). Each transformation was performed in either the isolated A1 or A2 domain, respectively (bars with horizontal lines) and in the A1A2 complex model where the specific methionine residue is located at the interface (bars with oblique lines). The protein structure (isolated A1 or A2, or A1A2 complex model) where the transformation was performed is indicated at the top of the plot. The reported values are averages over three simulations while error bars denote standard errors of the mean. An asterisk (*) indicates a difference that is statistically significant (p-value calculated from a Student’s t-test smaller than 0.05) while a plus (+) indicates a difference that is marginally statistically significant (p-value between 0.05 and 0.10). (b) The estimated ΔΔG of binding due to the conversion of an individual methionine residue to methionine sulfoxide (see “Materials and Methods” and Figure 2). A positive value indicates that oxidation of a specific methionine residue is thermodynamically unfavorable for binding. Error bars in (b) are derived from the error values displayed in (a) using the error propagation formula: , where SEM1 and SEM2 are the standard errors of the mean of ΔGalch.1 and ΔGalch.2, respectively.
