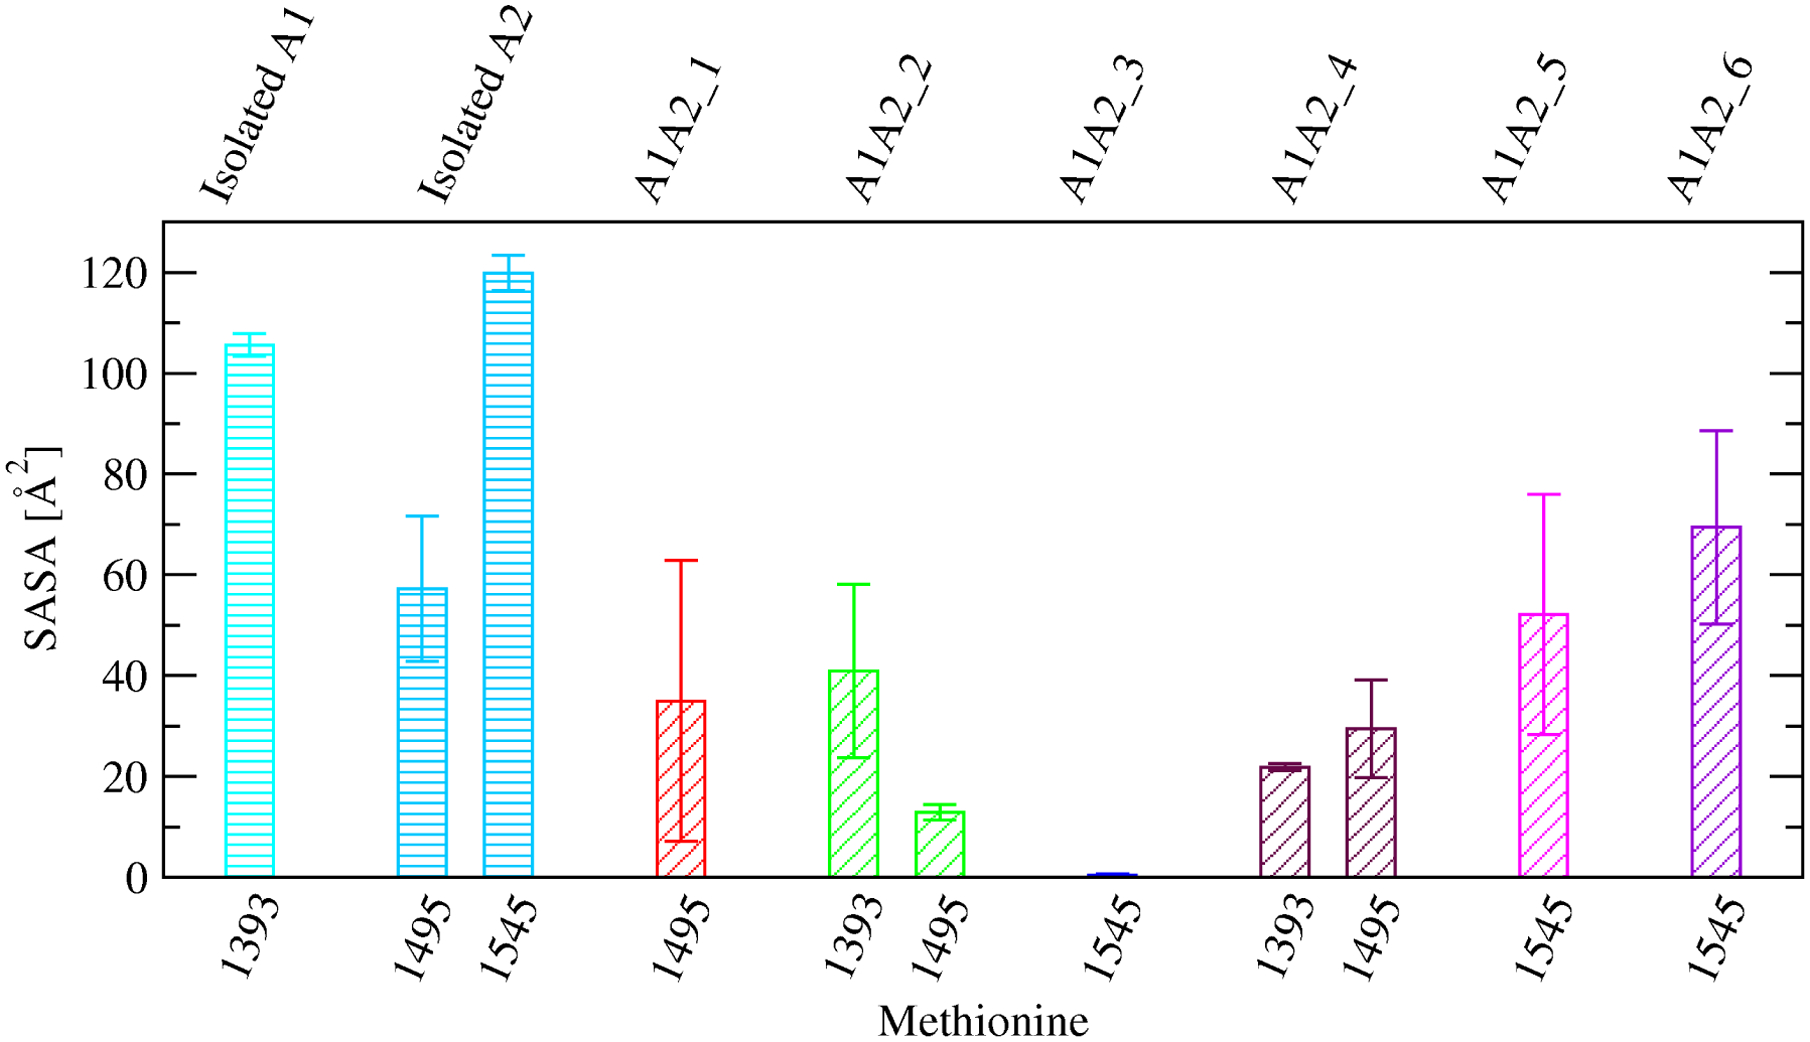
Figure 7: SASA of methionine residues located at the inter-domain interface.

Comparison of SASA values of specific methionine side chains between the isolated A1 or A2 domain, respectively (bars with horizontal lines), and the A1A2 complex models where the specific methionine residue is located near the interface (bars with oblique lines). Reported are averages and standard errors of the mean over two simulations for the isolated A1 domain and the complex models, and three simulations for the isolated A2 domain, respectively.
