FIGURE 5.

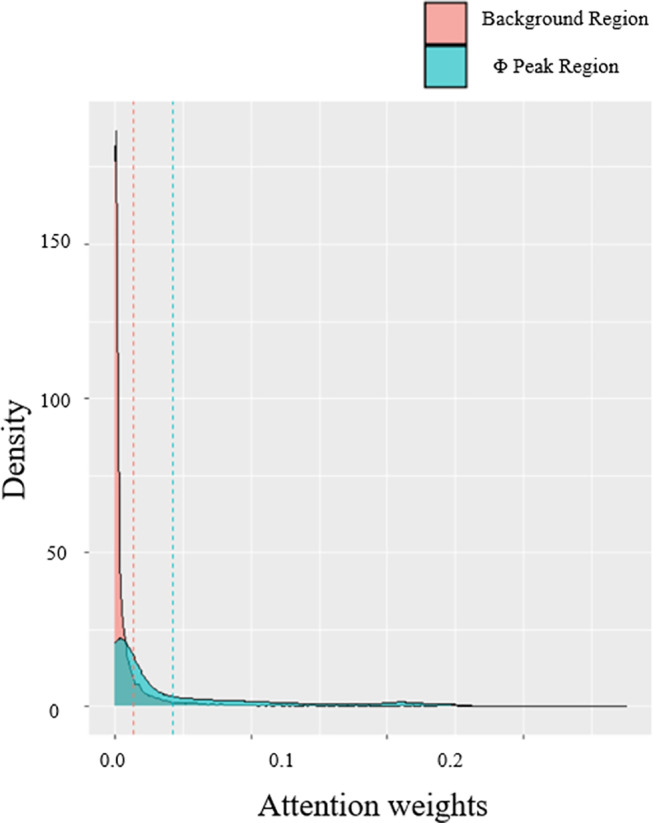
Comparison of attention scores from regions of the highest Φ‐value peak and scores from the rest regions. The attention scores are averaged across all four heads [Color figure can be viewed at wileyonlinelibrary.com]

Comparison of attention scores from regions of the highest Φ‐value peak and scores from the rest regions. The attention scores are averaged across all four heads [Color figure can be viewed at wileyonlinelibrary.com]