FIGURE 6.

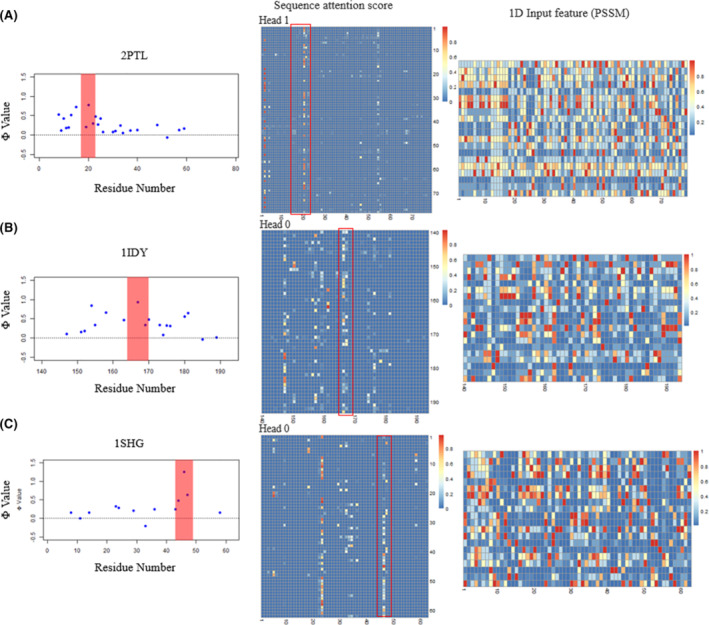
The visualization of Φ‐values, sequence attention score and 1D input feature (PSSM) for three proteins 2PTL, A; 1IDY, B; and 1SHG, C [Color figure can be viewed at wileyonlinelibrary.com]

The visualization of Φ‐values, sequence attention score and 1D input feature (PSSM) for three proteins 2PTL, A; 1IDY, B; and 1SHG, C [Color figure can be viewed at wileyonlinelibrary.com]