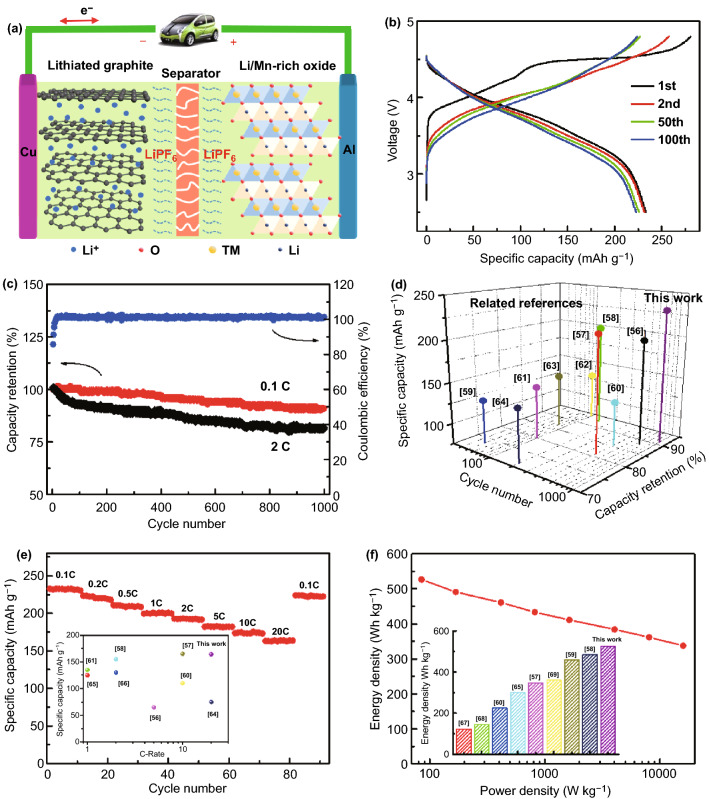
Fig. 6.
Electrochemical performance of GCNT@ST-MNC//nanographite full cell. a Schematic of the assembled full cell. b Galvanostatic charge/discharge curves with 1st, 2nd, 50th and 100th cycle at 0.1 C. c Cycling performance at 0.1 C and 2 C (Coulombic efficiency at 0.1 C). d Comparison of specific capacity and cycling performance of our work with other reported full cells. e Rate performance at various rates from 0.1 to 20 C (the inset is the comparison of specific capacity at high rate). f Ragone plots based on total mass of cathode and anode (the inset is the comparison of energy density)

