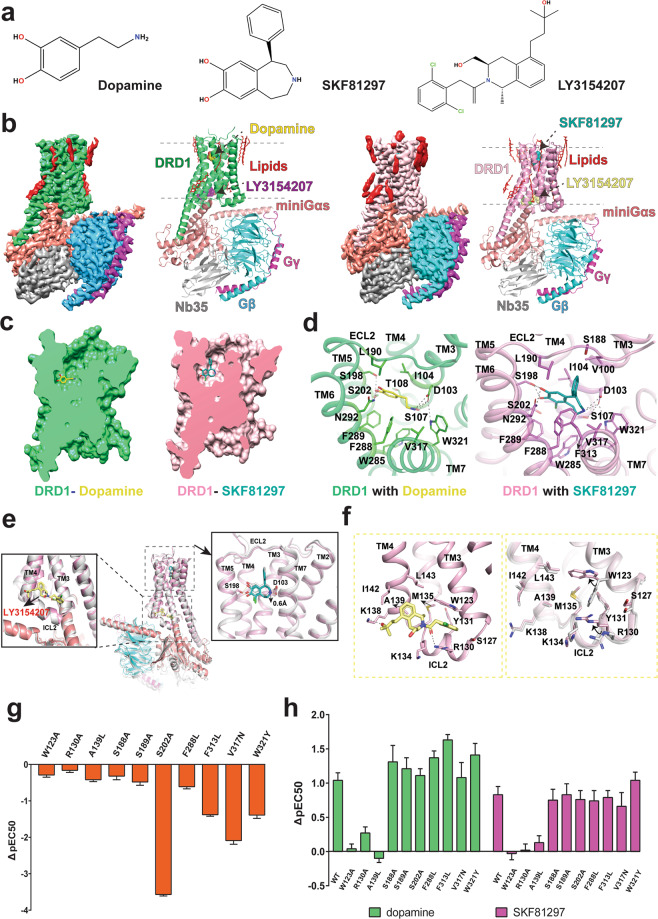
Fig. 1. Structures of DRD1–Gs complexes.
a Chemical structures of ligands. b Cryo-EM maps and structures of the DRD1–dopamine–Gs complex and the DRD1–SKF81297–Gs complex, both in the presence of LY3154207. The maps are shown at 0.045 and 0.083 thresholds for DRD1–dopamine/LY3154207–Gs complex and DRD1–SKF81297/LY3154207–Gs complex, respectively. c The dopamine and SKF81297 OBPs. d Interactions of dopamine and SKF81297 with DRD1. e Superposition of DRD1–SKF81297–Gs structures with or without LY3154207. The structure without PAM (white); the structure with PAM (DRD1, pink; SKF81297, teal; LY3154207, light yellow; Gαs, salmon; Gβ, cyan; Gγ, magenta). The hydrogen bond interactions are shown as black dashed line and yellow dashed line for DRD1–SKF81297 structure and DRD1–SKF81297/LY3154207 structure, respectively. f The binding mode of LY3154207 (left panel) and the conformational differences of the DRD1 allosteric binding site with or without LY3154207 (right panel). LY3154207 was removed in the right panel for better presentation of the alignment. g cAMP accumulation analysis of WT DRD1 and DRD1 mutants activated by dopamine. Data are presented as means ± SEM with a minimum of two technical replicates and n = 3 biological replicates. Greek letter delta (Δ) represents the difference between pEC50 values of the mutant DRD1 and the WT receptor (ΔpEC50) . h Comparison of dopamine and SKF81297 in cAMP accumulation assays with WT and mutant DRD1 in the presence or absence of 30 nM LY3154207. Data are presented as means ± SEM with a minimum of two technical replicates and n = 3 biological replicates. ΔpEC50 is for the comparison of the pEC50s of WT or each mutant in the presence of 30 nM LY3154207, with those in the absence of LY3154207.

