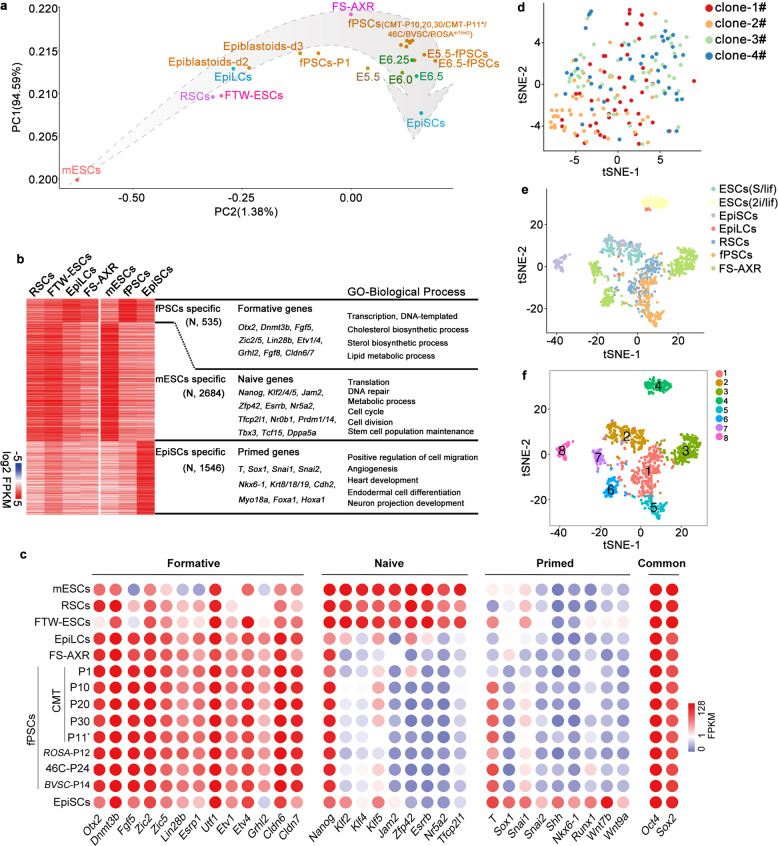
Fig. 4. Self-renewing fPSCs are transcriptomically similar to early gastrula epiblasts.
a Principle component analysis (PCA) of naïve mESCs, EpiSCs, EpiLCs, RSCs,42 FTW-ESCs,44 FS-AXR,43 Epiblastoids-d2/3, fPSCs-P1 (CMT passage 1), fPSCs (CMT-P10, 20, 30/CMT-P11*/46 C/BVSC/ROSAmT/mG), E5.5-, E6.5-fPSCs, and E5.5–E6.5 (E5.5–E6.5 epiblast cells).30–32 CMT-P11*, cryopreserved passage 11 of the fPSCs derived from CMT; fPSCs (46 C/BVSC/ROSAmT/mG), passage 24/14/12; E5.5-, E6.5-fPSCs, fPSCs derived from mouse E5.5 and 6.5 epiblasts. b Heatmap of the highly expressed genes (N, number of genes) in naïve mESCs, EpiSCs and fPSCs (fold change ≥ 1.5, FPKM value ≥ 3). Representative genes of different clusters were selected and listed in the middle. GO enrichment term results of the highly expressed genes in fPSCs, mESCs and EpiSCs were shown on the right. The expression of these specific genes in RSCs, FTW-ESCs, 48 h EpiLCs and FS-AXR were also shown in the heatmap. c The gene expression of selected formative, primed, naïve and common pluripotent markers in mESCs, RSCs, FTW-ESCs, EpiLCs, FS-AXR, fPSCs (different passages and background), and EpiSCs detected by RNA-seq. d t-SNE analysis of scRNA-seq data of fPSCs. Clone1/2/3/4# represented four independent clones of fPSCs-Passage11 (fPSCs-P11). e Data integration and t-SNE analysis of fPSC single cells with previous data of ESCs (2i/lif, Serum/lif), EpiLCs (48 h), RSCs, FS-AXR and EpiSCs.42,43,53,54 The originating cell types were labeled with different colors. f The integrated data of mESCs (2i/lif, Serum/lif), EpiLCs (48 h), RSCs, FS-AXR, fPSCs, and EpiSCs were further clustered into eight cell populations through t-SNE analysis. Different cell populations were represented by different colors (cluster-1 to -8).

