Figure 1.
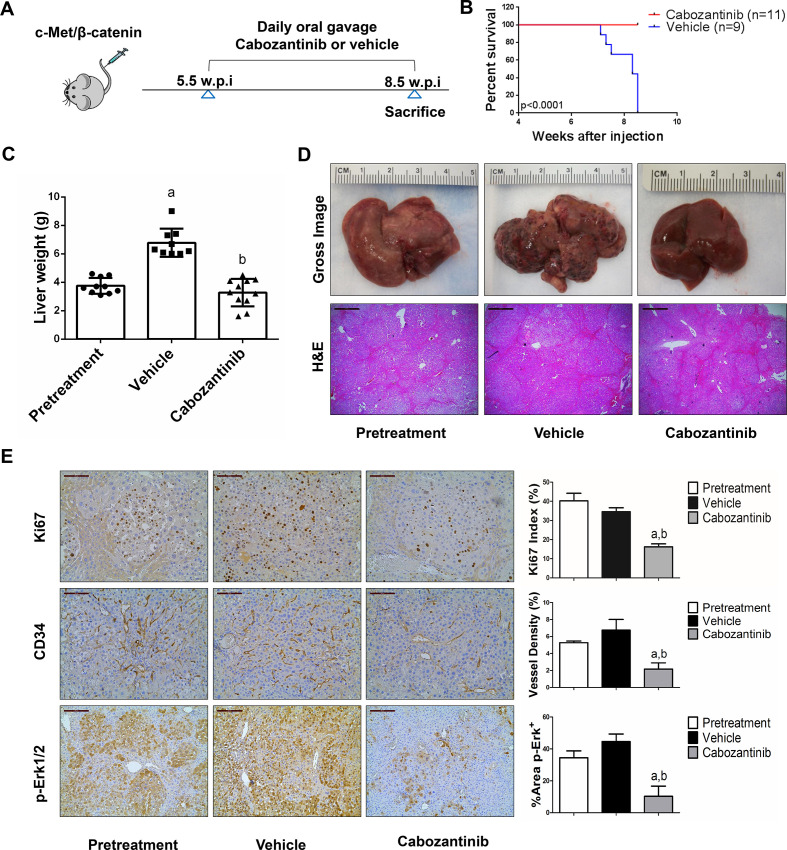
Cabozantinib treatment induces stable disease in c-Met/β-catenin mice. (A) Scheme of the experiment. (B) Survival curve of vehicle-treated and cabozantinib-treated c-Met/β-catenin mice. (C) Liver weight of pretreatment, vehicle-treated and cabozantinib-treated c-Met/β-catenin mice. (D) Gross images and H&E staining of livers from pretreatment, vehicle-treated and cabozantinib-treated c-Met/β-catenin mice. Magnification ×40; scale bar=500 µm. (E) Ki-67 (magnification ×200; scale bar=100 µm), CD34 (magnification ×200; scale bar=100 µm) and p-Erk (magnification,×100; scale bar=200 µm) staining in livers from c-Met/ β-catenin mice. Ki-67 positive cells were counted and quantified as proliferation index. CD34 and p-Erk staining were quantified and represented as the percentage of the positive staining area of the whole section area. Tukey–Kramer test: at least p<0.05. a, versus pretreatment; b, versus vehicle.

