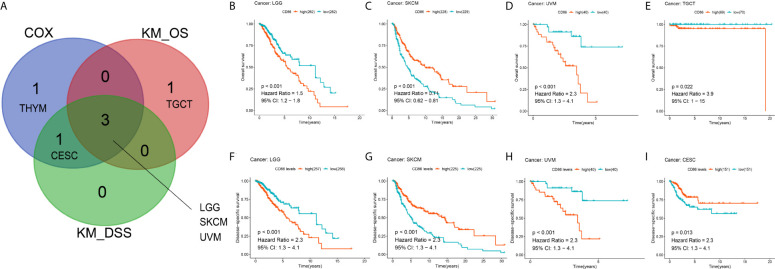
Figure 3.
Kaplan-Meier analysis with CD86 expressions in different cancer types. (A) The Venn diagram of the identified cancer types in cox regression analysis and Kaplan-Meier method. (B–E) Kaplan-Meier survival curve showing the prognostic value of CD86 on OS in LGG (B), SKCM (C), UVM (D), TGCT (E). (F–I) Kaplan-Meier survival curve showing the prognostic value of CD86 on DSS in LGG (F), SKCM (G), UVM (H), CESC (I).

