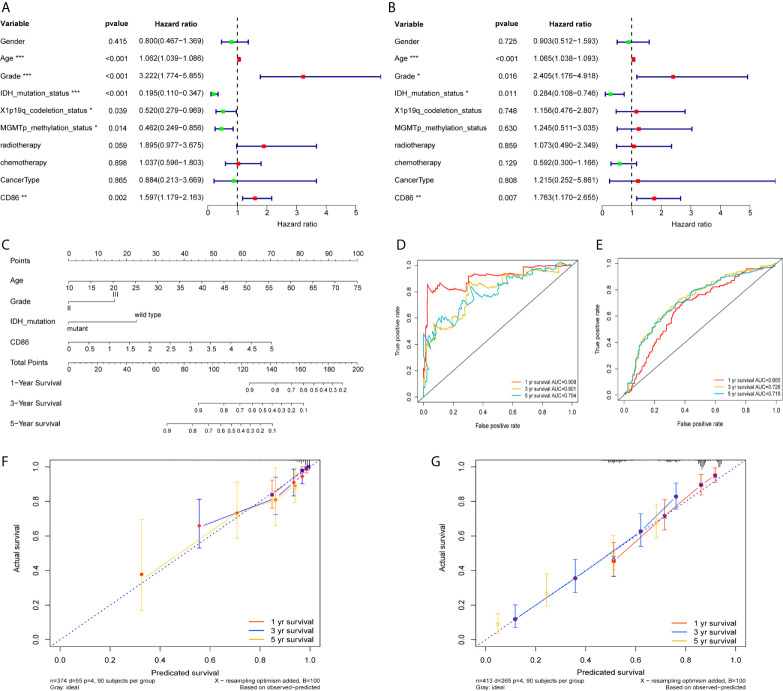
Figure 7.
Development and validation of a Nomogram. Univariate Cox regression (A) and Multivariate Cox regression (B) with CD86 expression, demographic and clinicopathological factors; Red dots represent risk factor (HRs>1), while green dots represent protective factor (HRs<1). *P<0.05, **P<0.01, ***P<0.001. (C) Nomogram with independent prognostic factors. ROC curve analysis at 1 year, 3years, and 5 years using TCGA dataset (D) and the CGGA dataset (E). Calibration plot at 1 year, 3years, and 5 years in TCGA (F) and the CGGA (G).

