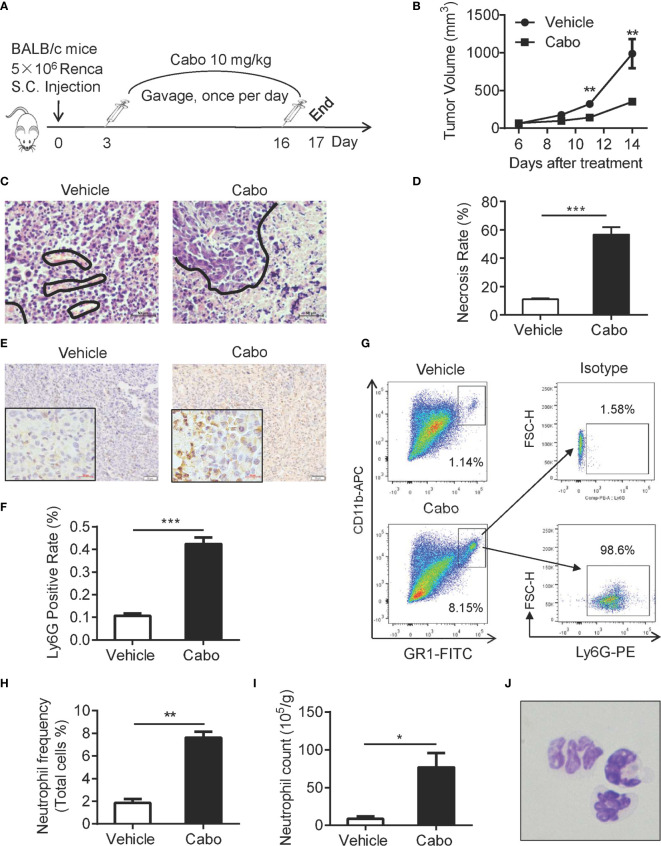
Figure 2.
Cabozantinib causes tumor growth inhibition and neutrophil infiltration into the tumor bed in a murine model of RCC. (A) Schematic diagram of the experimental design. 5×10⁶ Renca cells were subcutaneously inoculated into the right flank of BALB/c mice (day 0). On day 3, mice were randomly divided into 2 groups that received cabozantinib (10 mg/kg) or vehicle treatment once per day for 14 days. (B) Tumor growth curves during the experiment. (C, D) Representative results of H&E staining and quantitative analysis of necrotic area in tumor tissues. The area encircled by blue coil indicates necrotic tissue. (E, F) Representative IHC staining (anti-Ly6G, Brown color) and quantitative analysis of Ly6G+ cells in tumor tissues. (G) Tumor tissue was homogenized into single cell suspension. 1X10⁶ cells were stained with anti-mouse CD45, CD11b and Gr1 and ly6G antibodies, and analyzed by FACS. Representative FACS plots showing the frequencies of CD11b+Gr1hi cells in cabozantinib- or vehicle-treated tumors (left) and expression of Ly6G on CD11b+Gr1hi cells. (H) Quantitative analysis of CD11b+Gr1hi cell frequencies in tumors that received cabozantinib or vehicle treatment. (I) Quantitative analysis results of CD11b+Gr1hi cell count per gram of tumor tissue. (J) Morphological identification of CD11b+Gr1hi cells by Wright-Giemsa staining. Images were taken under 600× magnification. Representative data (Vehicle, n=8; Cabozantinib, n=10) of three independent experiments are shown (Vehicle, n=24; Cabozantinib, n=28 in total) with mean values ± SEM. *P<0.05, ***P<0.001 by unpaired t-test.

