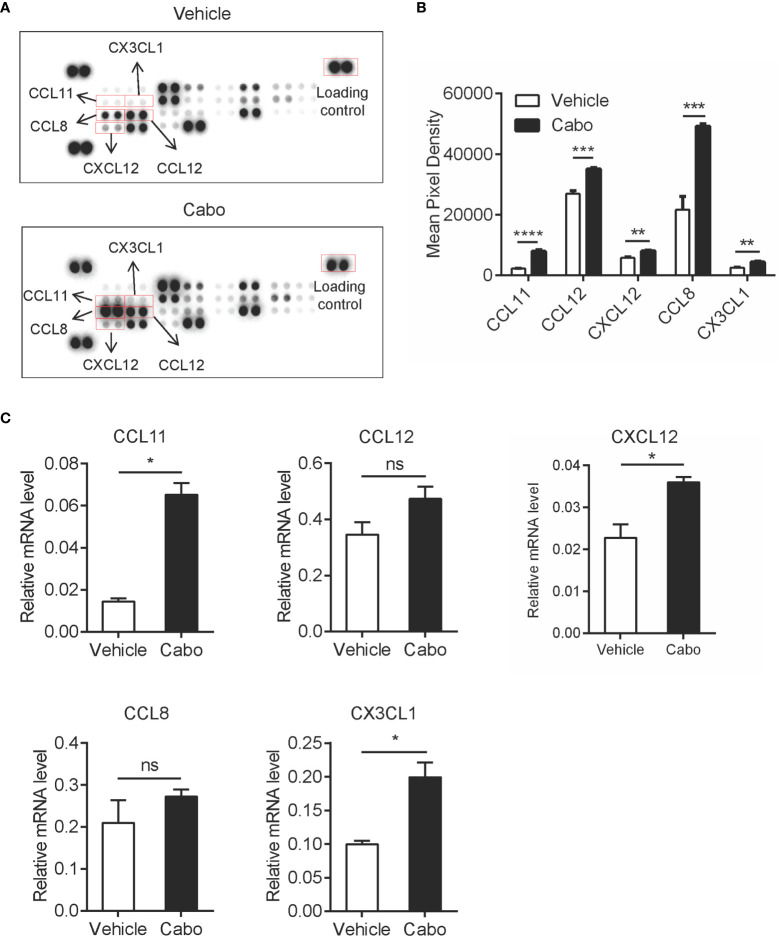
Figure 4.
Cabozantinib causes upregulation of chemokines in the tumor microenvironment. Mice were treated as in Figure 2A . (A, B) At the end of the experiment, total protein was extracted from tumor tissues of two random mice per group. Levels of 25 chemokines were detected using mouse chemokine antibody array kits. Chemokine expression levels are presented as arbitrary units measured by densitometry (n=2, biological replicate). Representative films (A) and quantitative results (B) of chemokines by chemokine array analysis. (C) RNA was prepared from snap-frozen tumor tissue (n=3, biological replicate). Relative mRNA expression of chemokines was determined by qRT-PCR. Data are shown as the mean values ± SEM. *P<0.05, **P<0.01, ***P<0.001, ****P<0.0001 by unpaired t-test; ns, not significant.

