Figure 5.
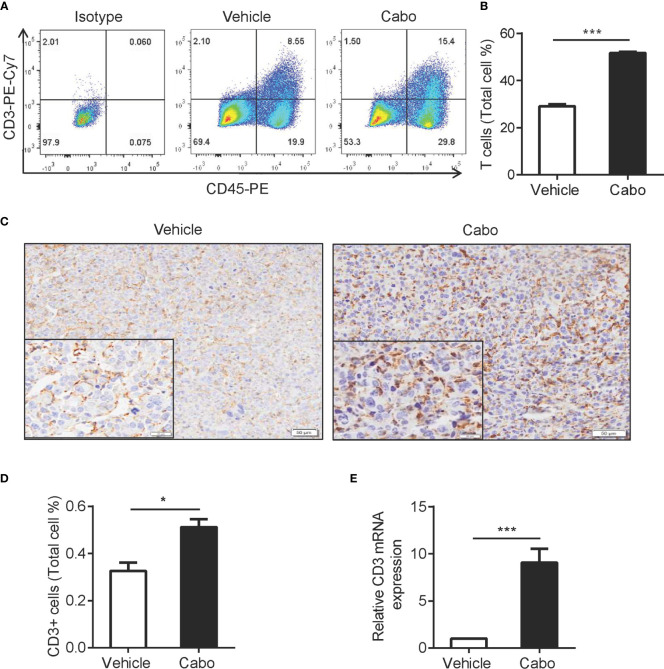
Cabozantinib treatment increases T cell infiltration into tumors. Mice were treated as in Figure 2A . (A, B) Representative FACS plot and quantitative results show the frequencies of T cells in tumors from vehicle- or cabozantinib-treated mice. (C, D) Representative IHC staining for CD3 (C) and quantitative results (D) of tumor infiltrating T cells in vehicle- or cabozantinib-treated mice. CD3 positive rates (D) were analyzed using Image-Pro Plus software based on 3 representative visual areas in each section from each tumor (n=6 per group). A-D experiments were repeated three times. (E) Mouse CD3 mRNA expression detected by quantitative RT-PCR. RNA was extracted from tumor tissue from mice that received vehicle or cabozantinib treatment. Expression levels are normalized to vehicle (n=3 for biological replicate). *P<0.05, ***P<0.001 by unpaired t-test. This experiment was repeated two times.

