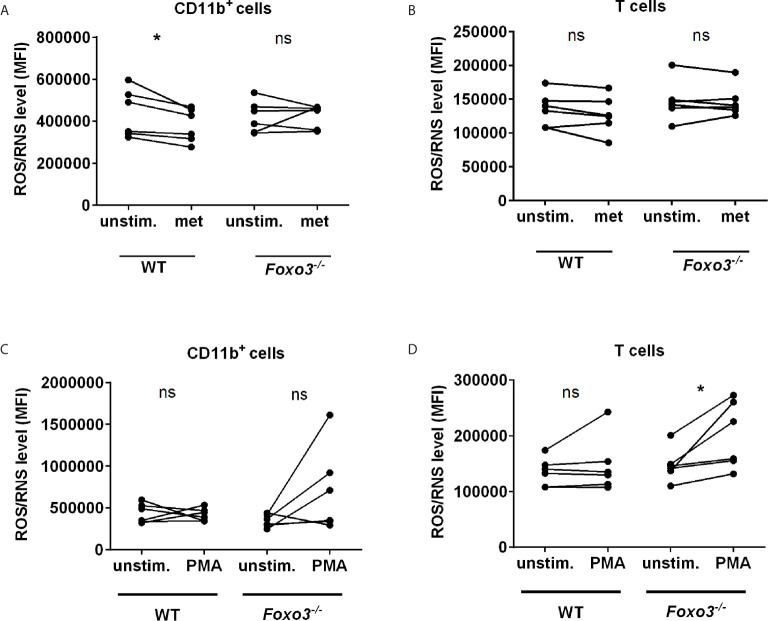
Figure 4.
ROS/RNS production is reduced by metformin in WT and induced by PMA in Foxo3-/- mice. ROS/RNS level was analysed in WT vs. Foxo3-/- splenocytes after 3 h of metformin [0.1 mM] (A, B) or 10 min of PMA [100 ng/ml] treatment (C, D). Mouse splenocytes were labeled with DCFH-DA and ROS/RNS level was analysed by FC (n=6) in (A, C) CD11b+ myeloid cells and (B, D) CD3+ T cells. Significance was evaluated using the Wilcoxon test. *P ≤ 0.05; ns, not significant.

