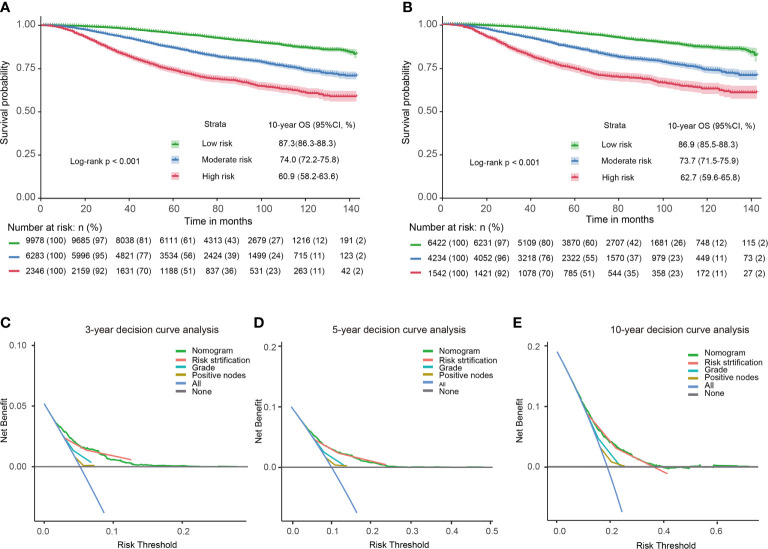
Figure 3.
Kaplan-Meier survival curves and decision curves for T1–2 breast cancer with 1–3 positive lymph nodes. Survival curves in the entire cohort before PSM (A) and after PSM (B) stratified by the total score of the nomogram. 3-year (C), 5-year (D), 10-year (E) decision curves show that nomogram and its risk stratification have the highest net benefit almost across the entire threshold probabilities. Blue line: net benefit of a strategy of treating all T1–2 breast cancer with 1–3 positive lymph nodes. Gray line: net benefit of treating no patients of T1–2 breast cancer with 1–3 positive lymph nodes. Colored lines: net benefit of a strategy of treating patients according to the nomogram, risk stratification, grade, and positive nodes.

