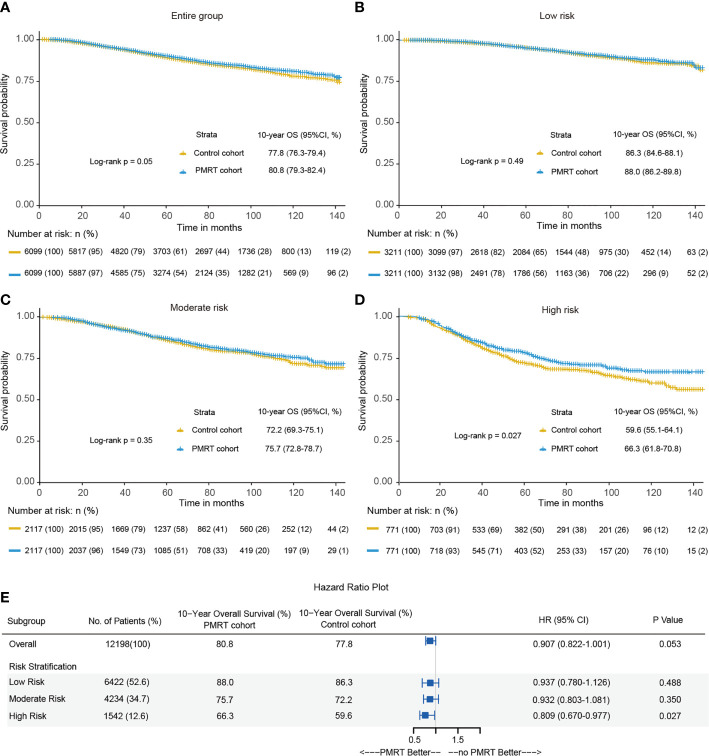
Figure 4.
Kaplan-Meier curves of overall survival between the PMRT cohort and observation cohort for the entire group (A), low-risk group (B), moderate-risk group (C) and high-risk group (D) after PSM. (E) The forest plot for hazard ratio (HR) comparing 10-year overall survival between the control cohort and PMRT cohort in different risk groups after PSM.

